

What you can see, the institutions can also see
What you can see, the institutions can also see
How to profit by being patient

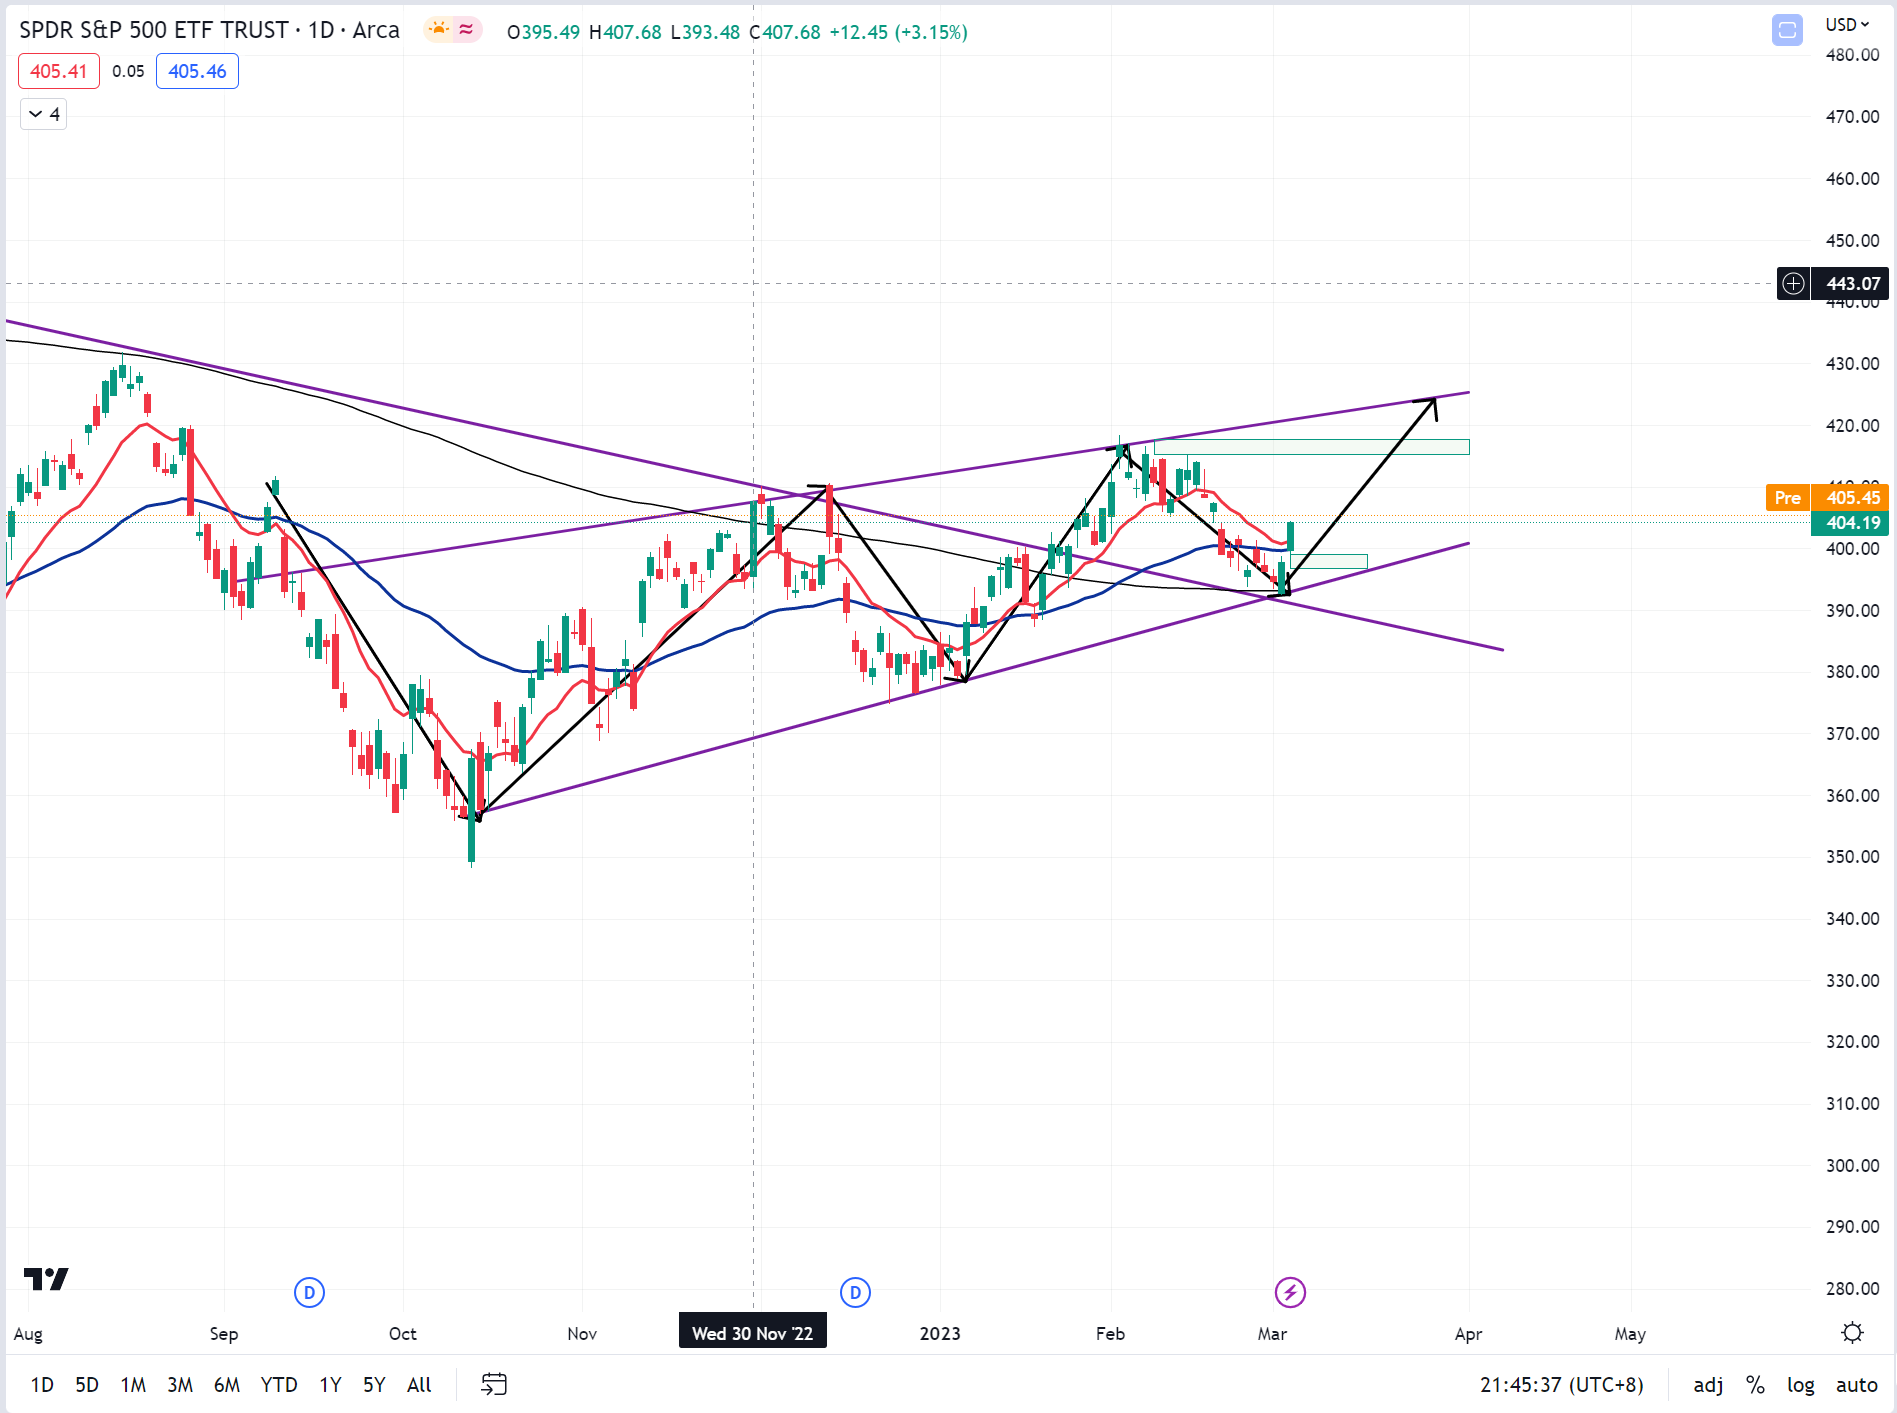
Can the charts be any more obvious??? Institutions love this stuff.
The markets have been full of traps in the last several months. It the current bounce on the previous descending trendline a sign that things are changing? Or have we bounced at the bottom of a rising wedge? We will only know what the market thinks after the fact.
Institutions have made great profits taking the opposite side of what seems to be evident. My take is that they will continue to try.
But there are some great opportunities presenting themselves if we are patient and use the correct strategy with conservative money management techniques.
So what am I looking at?
I see a good possibility of SPY retracing to the lower ascending trendline and then continuing to the $416 to $420 region. I see an equally good possibility that momentum will take over and SPY will continue to rise to the $416 to $420 area before stalling (or consolidating.
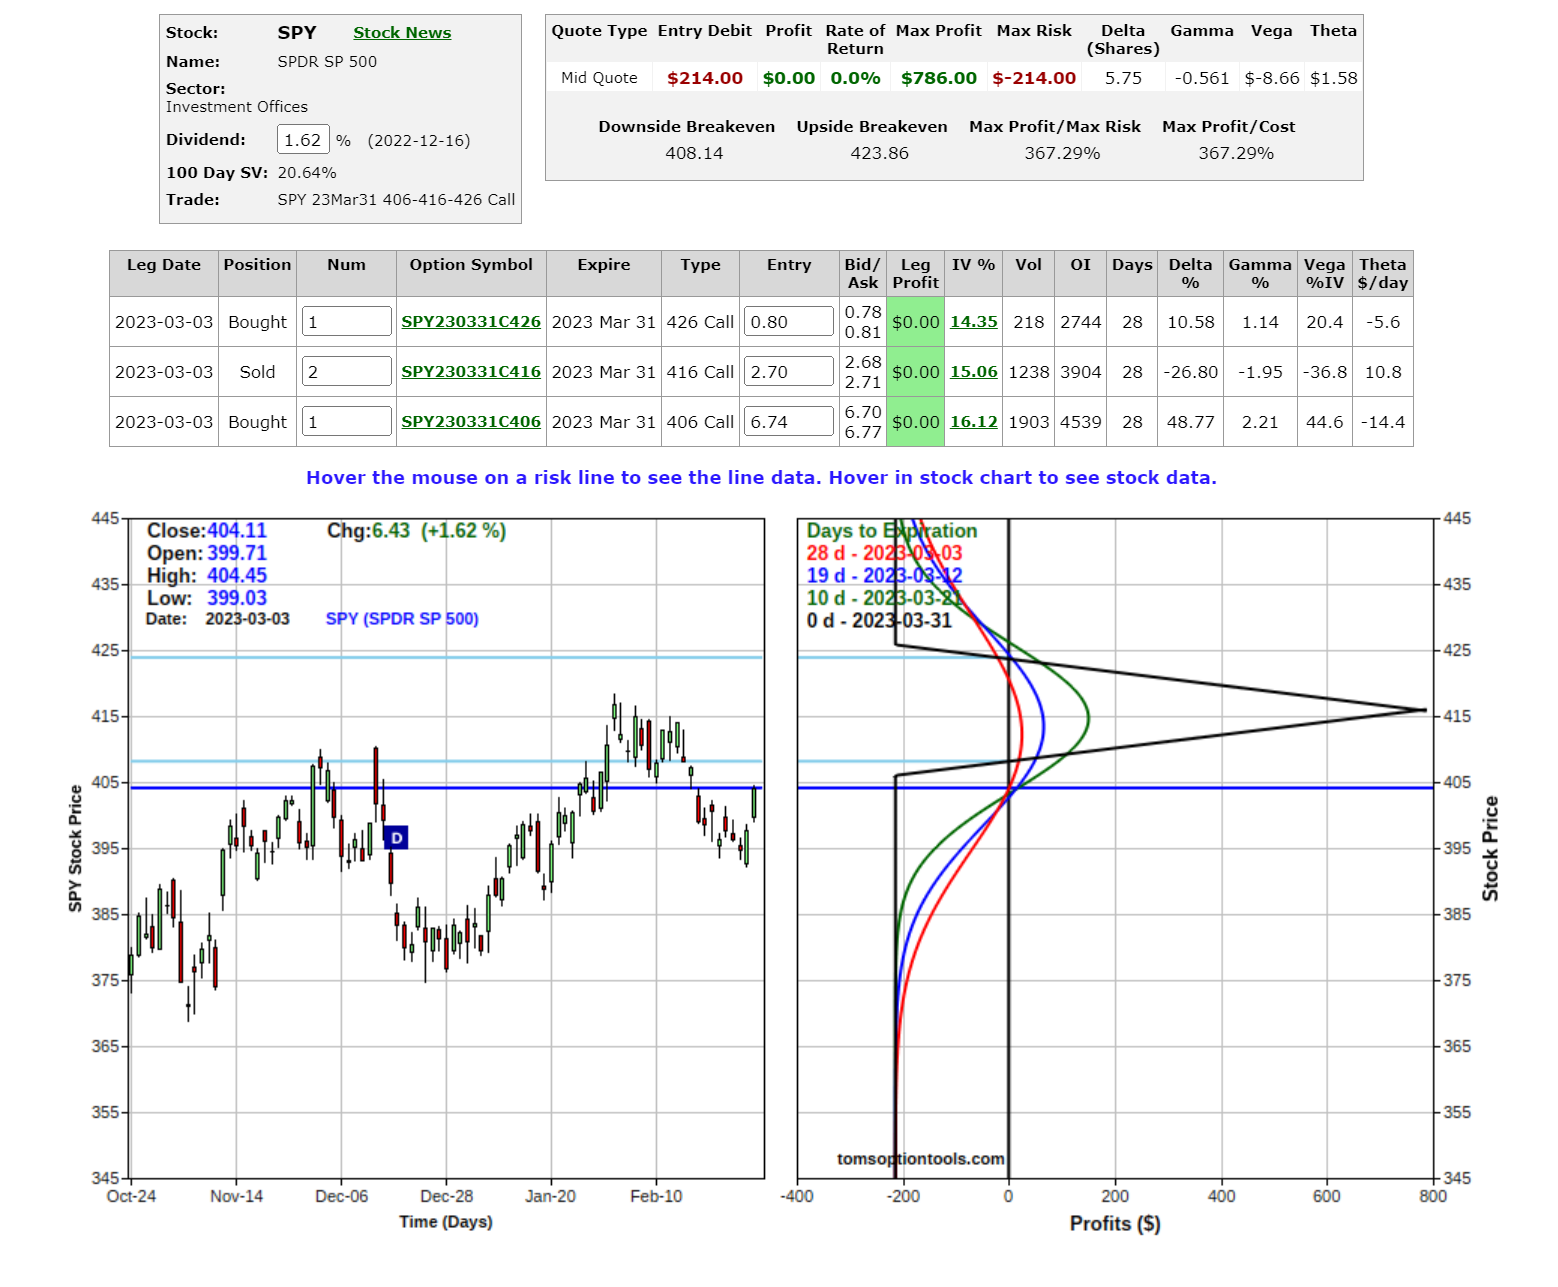
I these situations, I love taking low risk “all in” positions that will profit if my target is hit by my time projection, which is around the end of March.
In walks the butterfly sized to lose no more than 2% of my account if I am completely wrong. 2% of a $10,000 account is $200, so I want to pay around $200 for a position that will achieve max profit at my $416 price target.
Buying 1 x SPY Mar31 $406 call, selling 2 x SPY Mar31 $416 Call, and buying 1 x SPY Mar31 $426 call for $2.14 does the trick. What I usually will do for such opportunities is just put in an order for that price. If it fills it fills, if it doesn’t it doesn’t. Nothing ventured, nothing gained. Then, if SPY bombs, I lose $214. If it goes up, I take profit when SPY = $216.
Keep trading real. Keep it conservative. Sleep easy at night on swings because you have a plan.
Keep reading with a 7-day free trial
Subscribe to Green Goose Trader to keep reading this post and get 7 days of free access to the full post archives.