
System Development - Part II

Happy New Year!
I have been spending the last several weeks resting my mind, eating, drinking, etc… I was so happy to see January 1st roll in as I could then take a break from merry making. I’m sure there are many readers with the same thoughts.
This year will have many, many changes for my family and I - my Canadian company for my day job has asked me to establish an office in Europe. So, after 10 years we are pulling up stakes here in Southeast Asia and moving to the Paris region in July.
Anyway, for my trading life I couldn’t be happier. I am primarily a swing trader with overnight (GG & Earnings) or multiple day/week trades. This is valid for Equity Options, Foreign Exchange as well as all other asset classes. My preferred entry for all trades is at the end of the day when the daily candle and indicators are fully formed. Here in Southeast Asia that has meant getting up at 3:30 AM during the summer hours and at 4:30 AM during winter hours. Once the move is complete, the markets I follow will close in my evening.
On to the subject of this post… Before you go further, please read the following three previous posts - they are extremely important and a lead up to today’s article.
System Development - Part II (Introduction)
I am going to repeat my core system thesis from Part I with some small expansion.
My core system (algorithm) has five (or six) layers, in order of precedence
Trend Shift - using a baseline
Momentum Agreement with Trend - using a confirming indicator. This layer sometimes doubles as an Exit signal, in which case I eliminate #5 below.
Momentum Agreement with Trend - using a second confirming indicator
Momentum Agreement with Trend that doubles as an Exit Signal, which can be stand alone or one of my Momentum Indicators
Volume Agreement
ALL five (or six) layers must agree at the close of a candle for me to say GO. In addition, my entry price cannot be more than 1.5 x the Average True Range (ATR) from my Trend Shift baseline.
Risk and Money management are based on position sizing (risking) 2% of my capital and on placing an initial stop at my entry +/-1.5 x the ATR.
With respect to Forex or Futures trading and increasingly in Equity Option Trend trading, once I am in a position, I manage my trade as follows:
I take 1/2 profit when the price is at my entry +/- 1 x ATR and immediately move my stop to my entry price.
Once the trade profit hits 1.5 x ATR, I begin trailing the stop at 1.5 x ATR
I exit when my exit signal triggers.
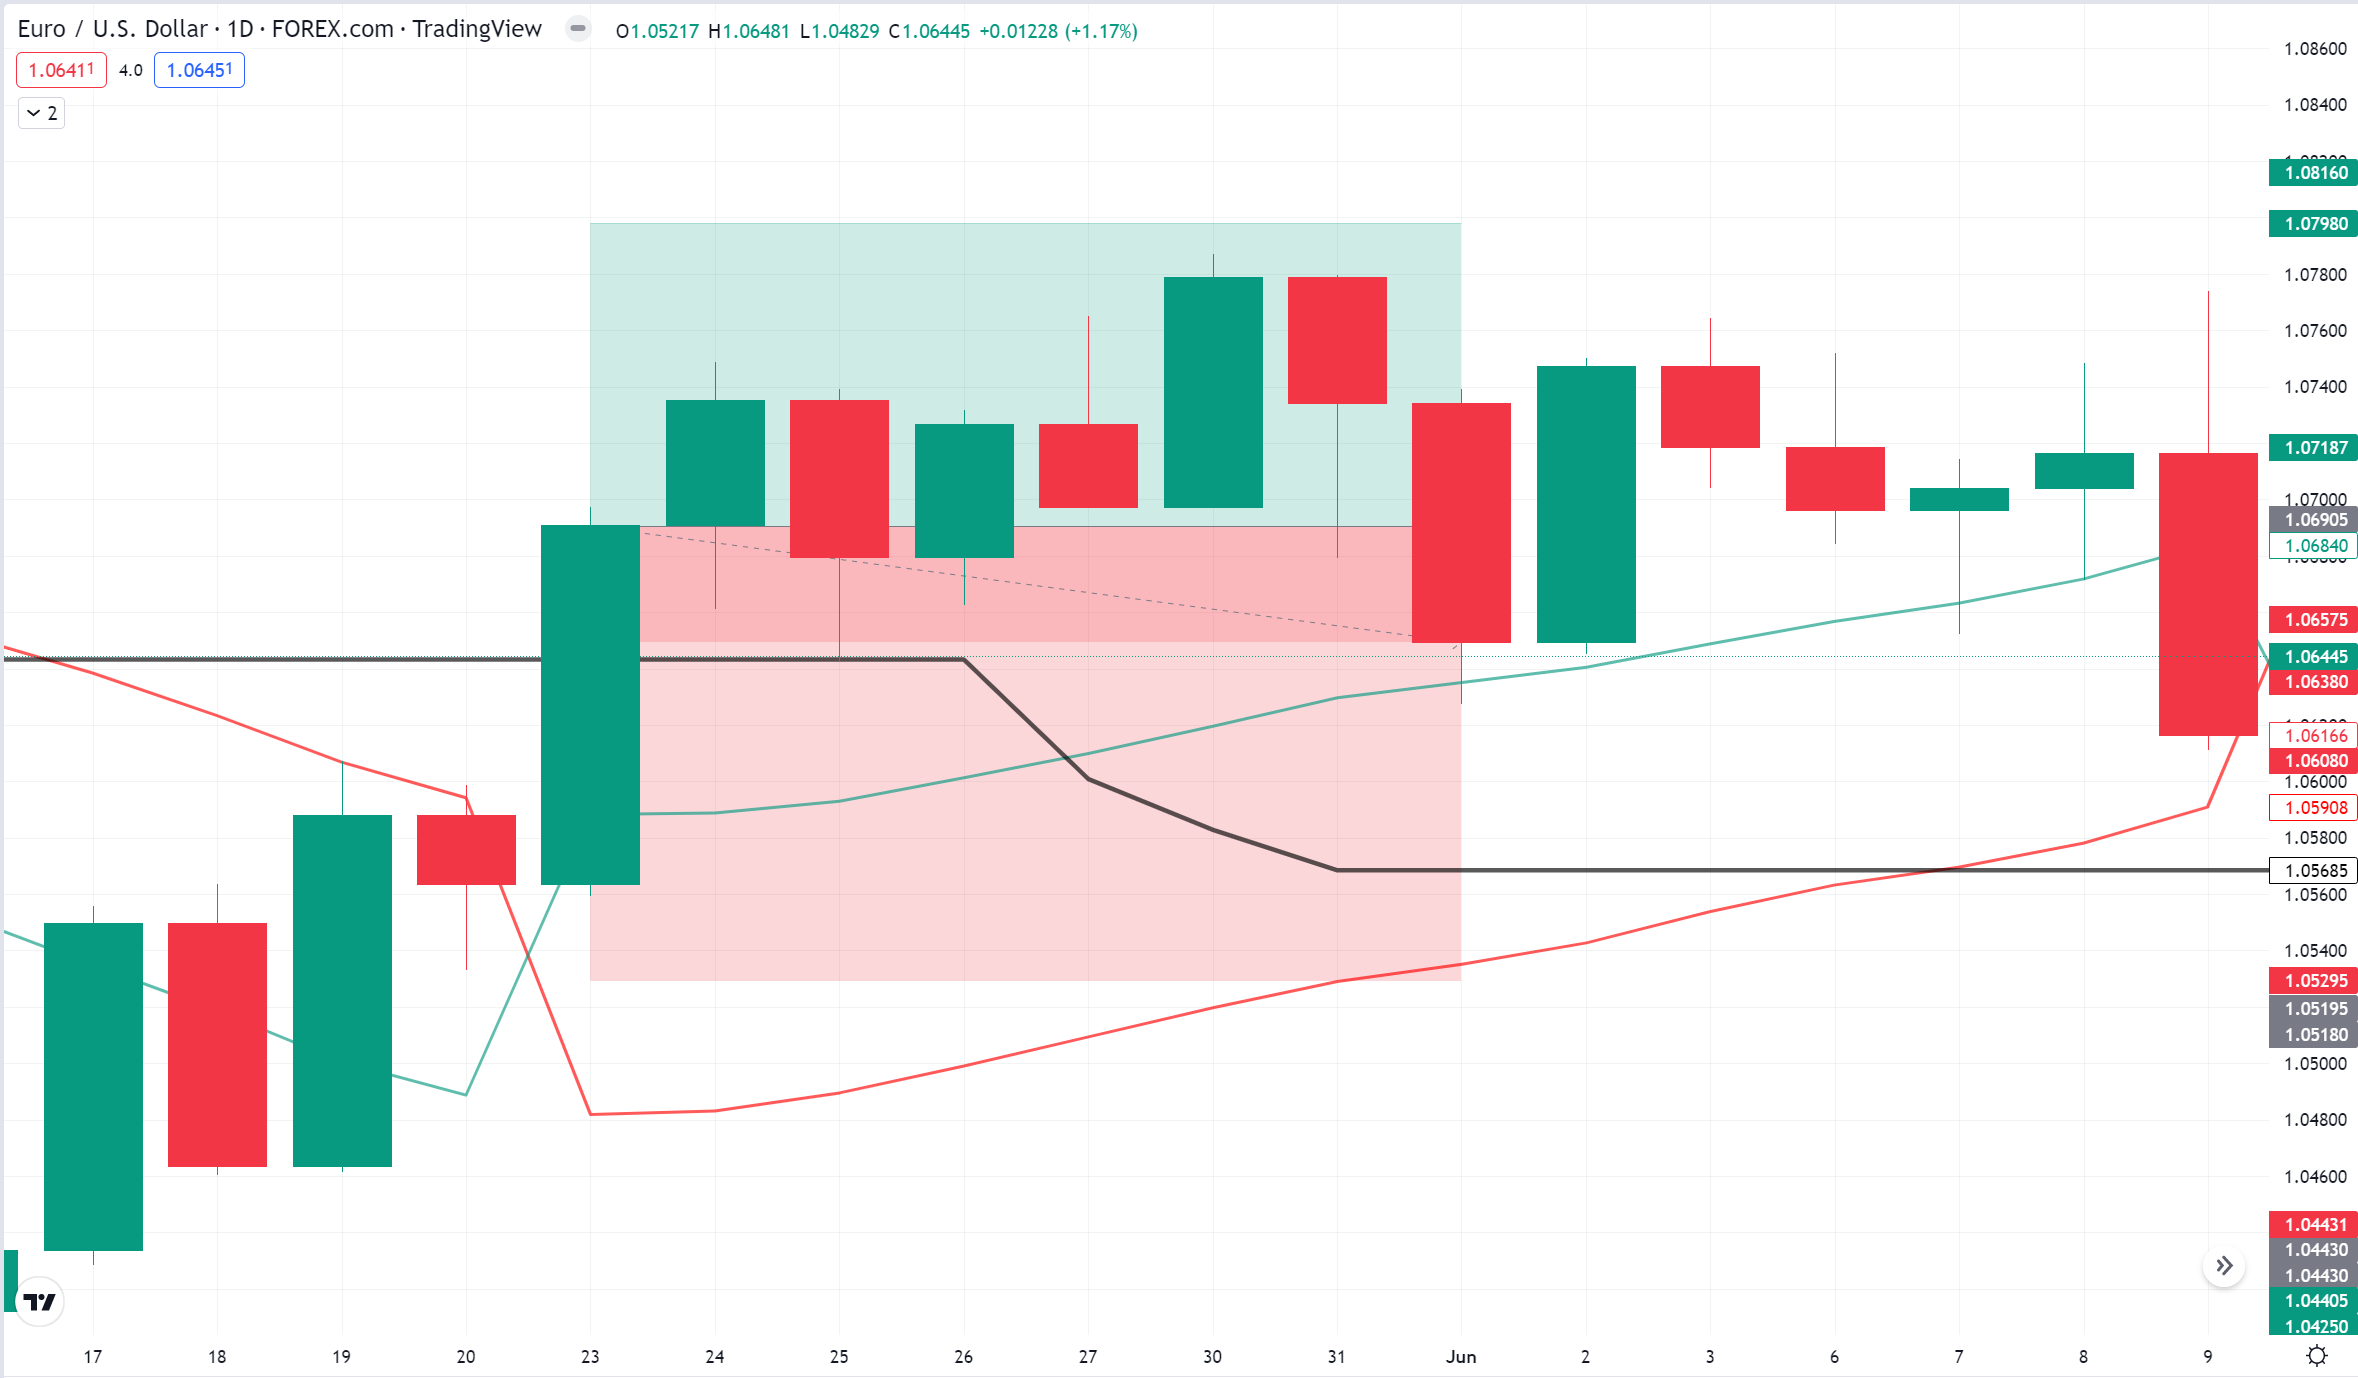
Example 1 on EURUSD
Spoiler alert - I’m not going to give free readers full visibility of my system. It is “my” system and works for me. I will however, show the logic of how the core concepts work together.
May 23, 2022 on the daily chart (which closes at 5:00 PM Wall Street Time)…
Price closes > baseline. Price is < 1.5 x ATR from baseline.
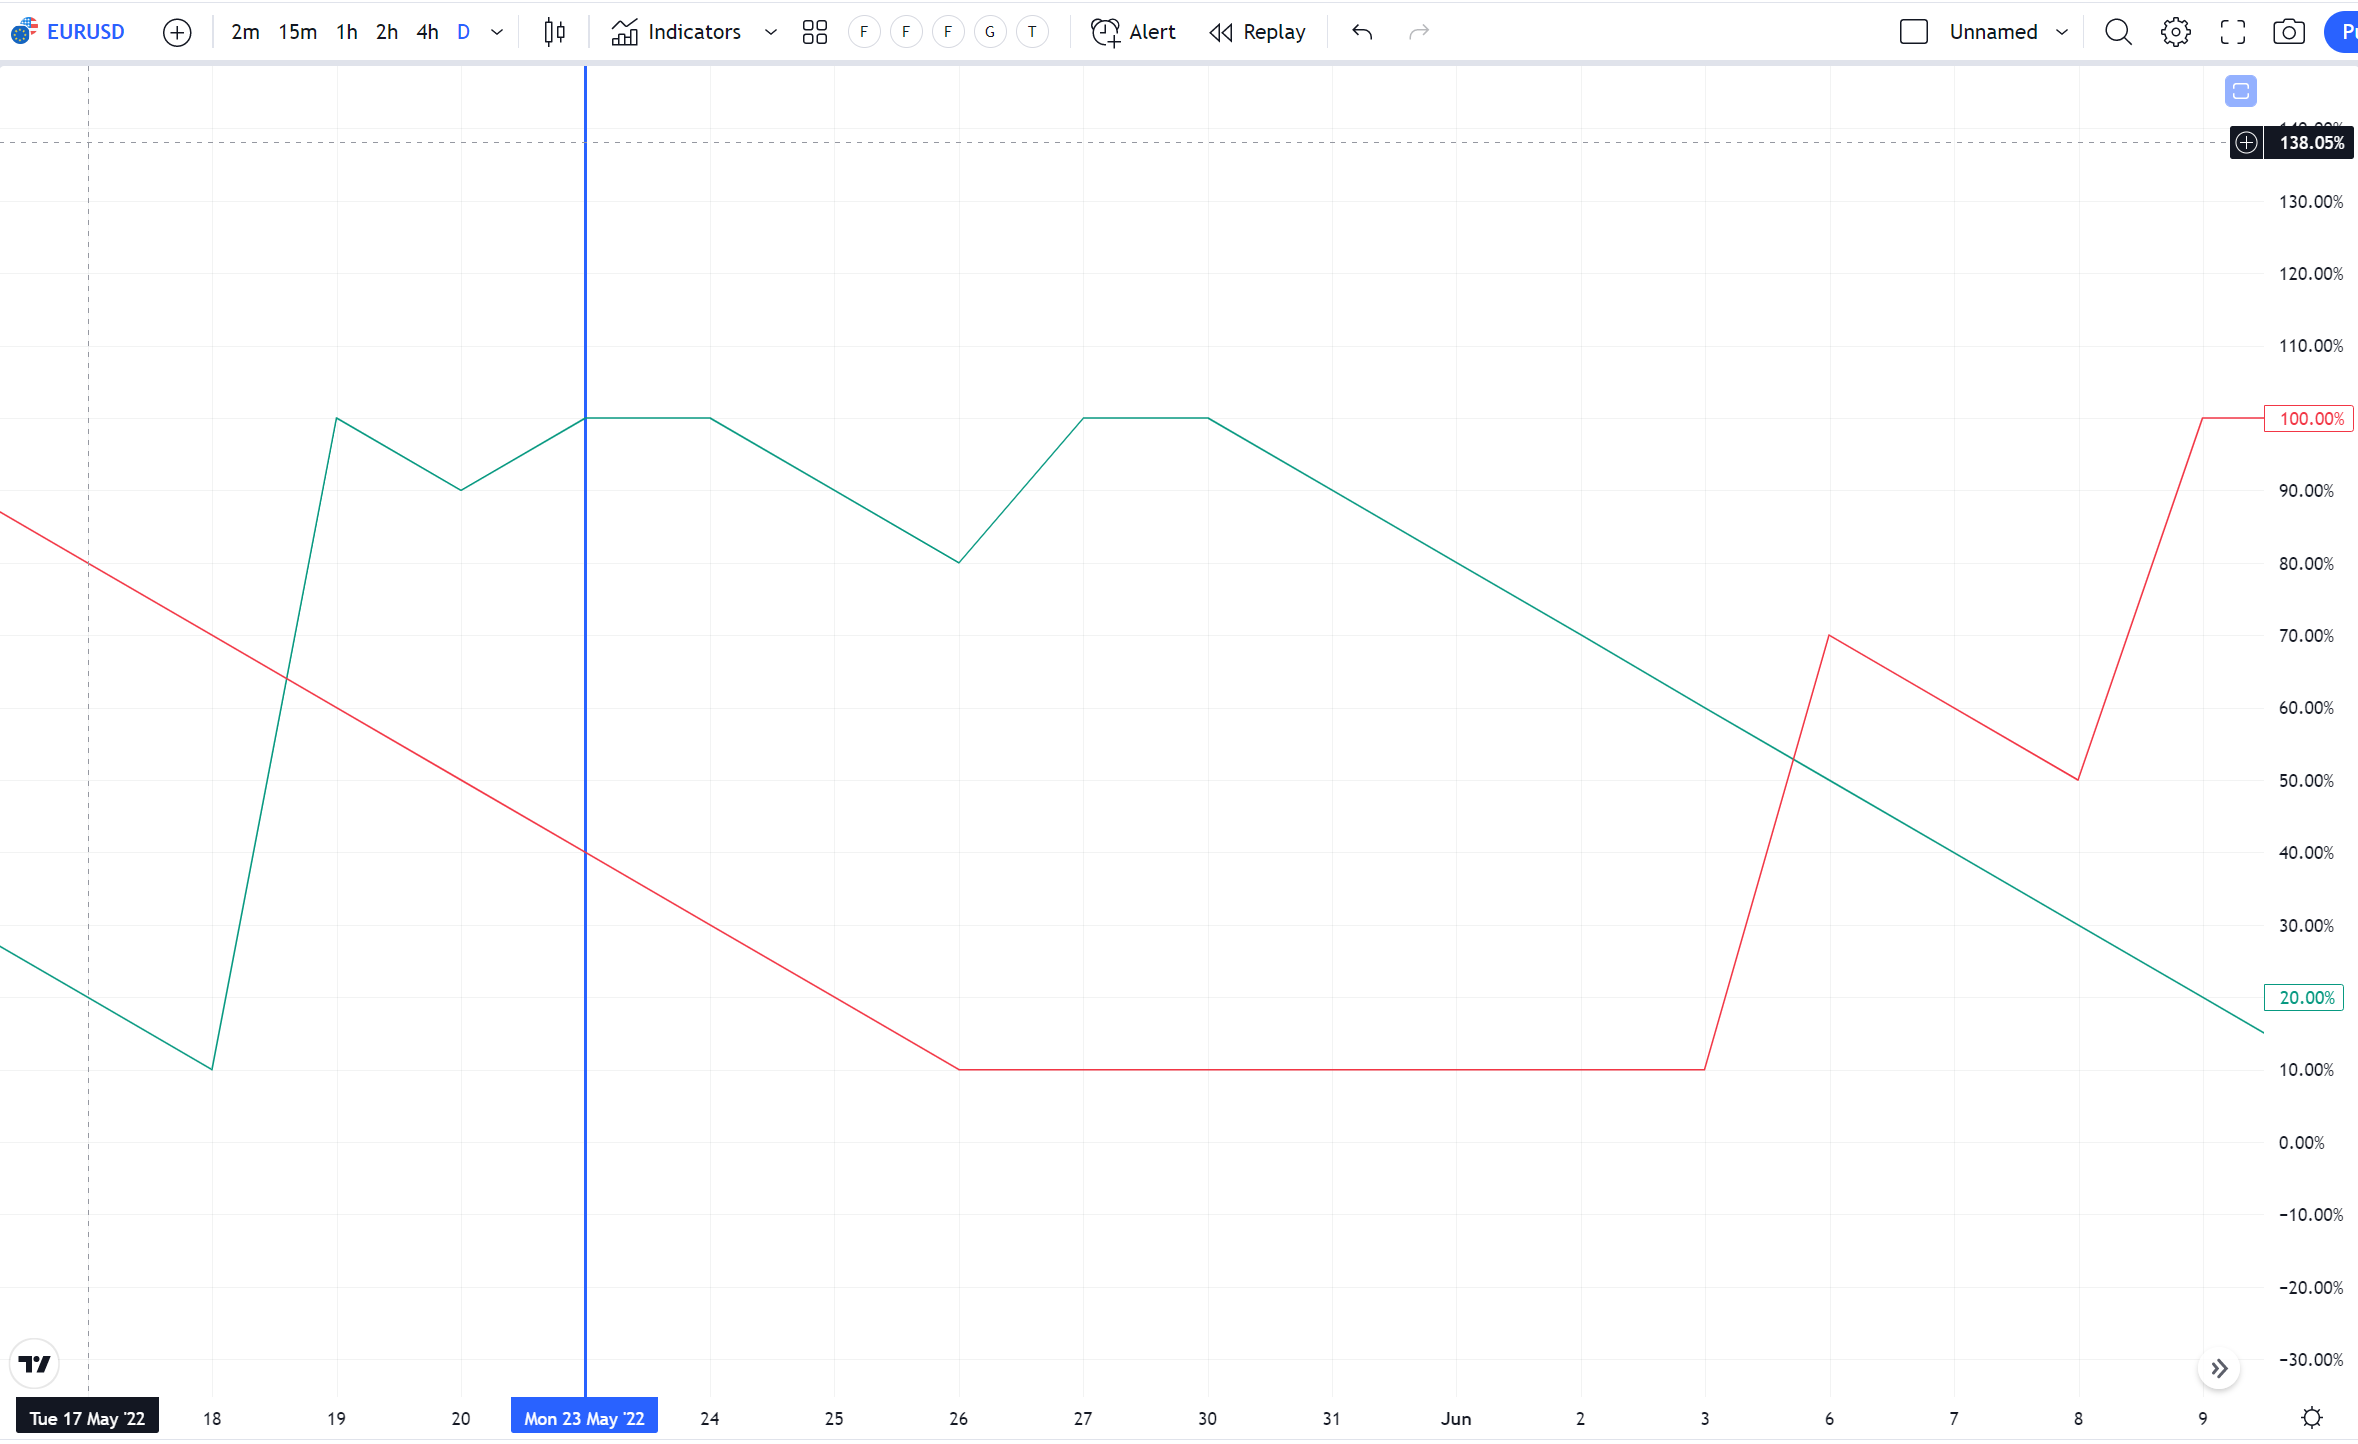
Momentum confirming indicator 1 (some readers here will recognized the SSL, which is briefly reviewed later in this post) crosses to bullish
Momentum confirming indicator is bullish.
Momentum confirming indicator/Exit Indicator is bullish.
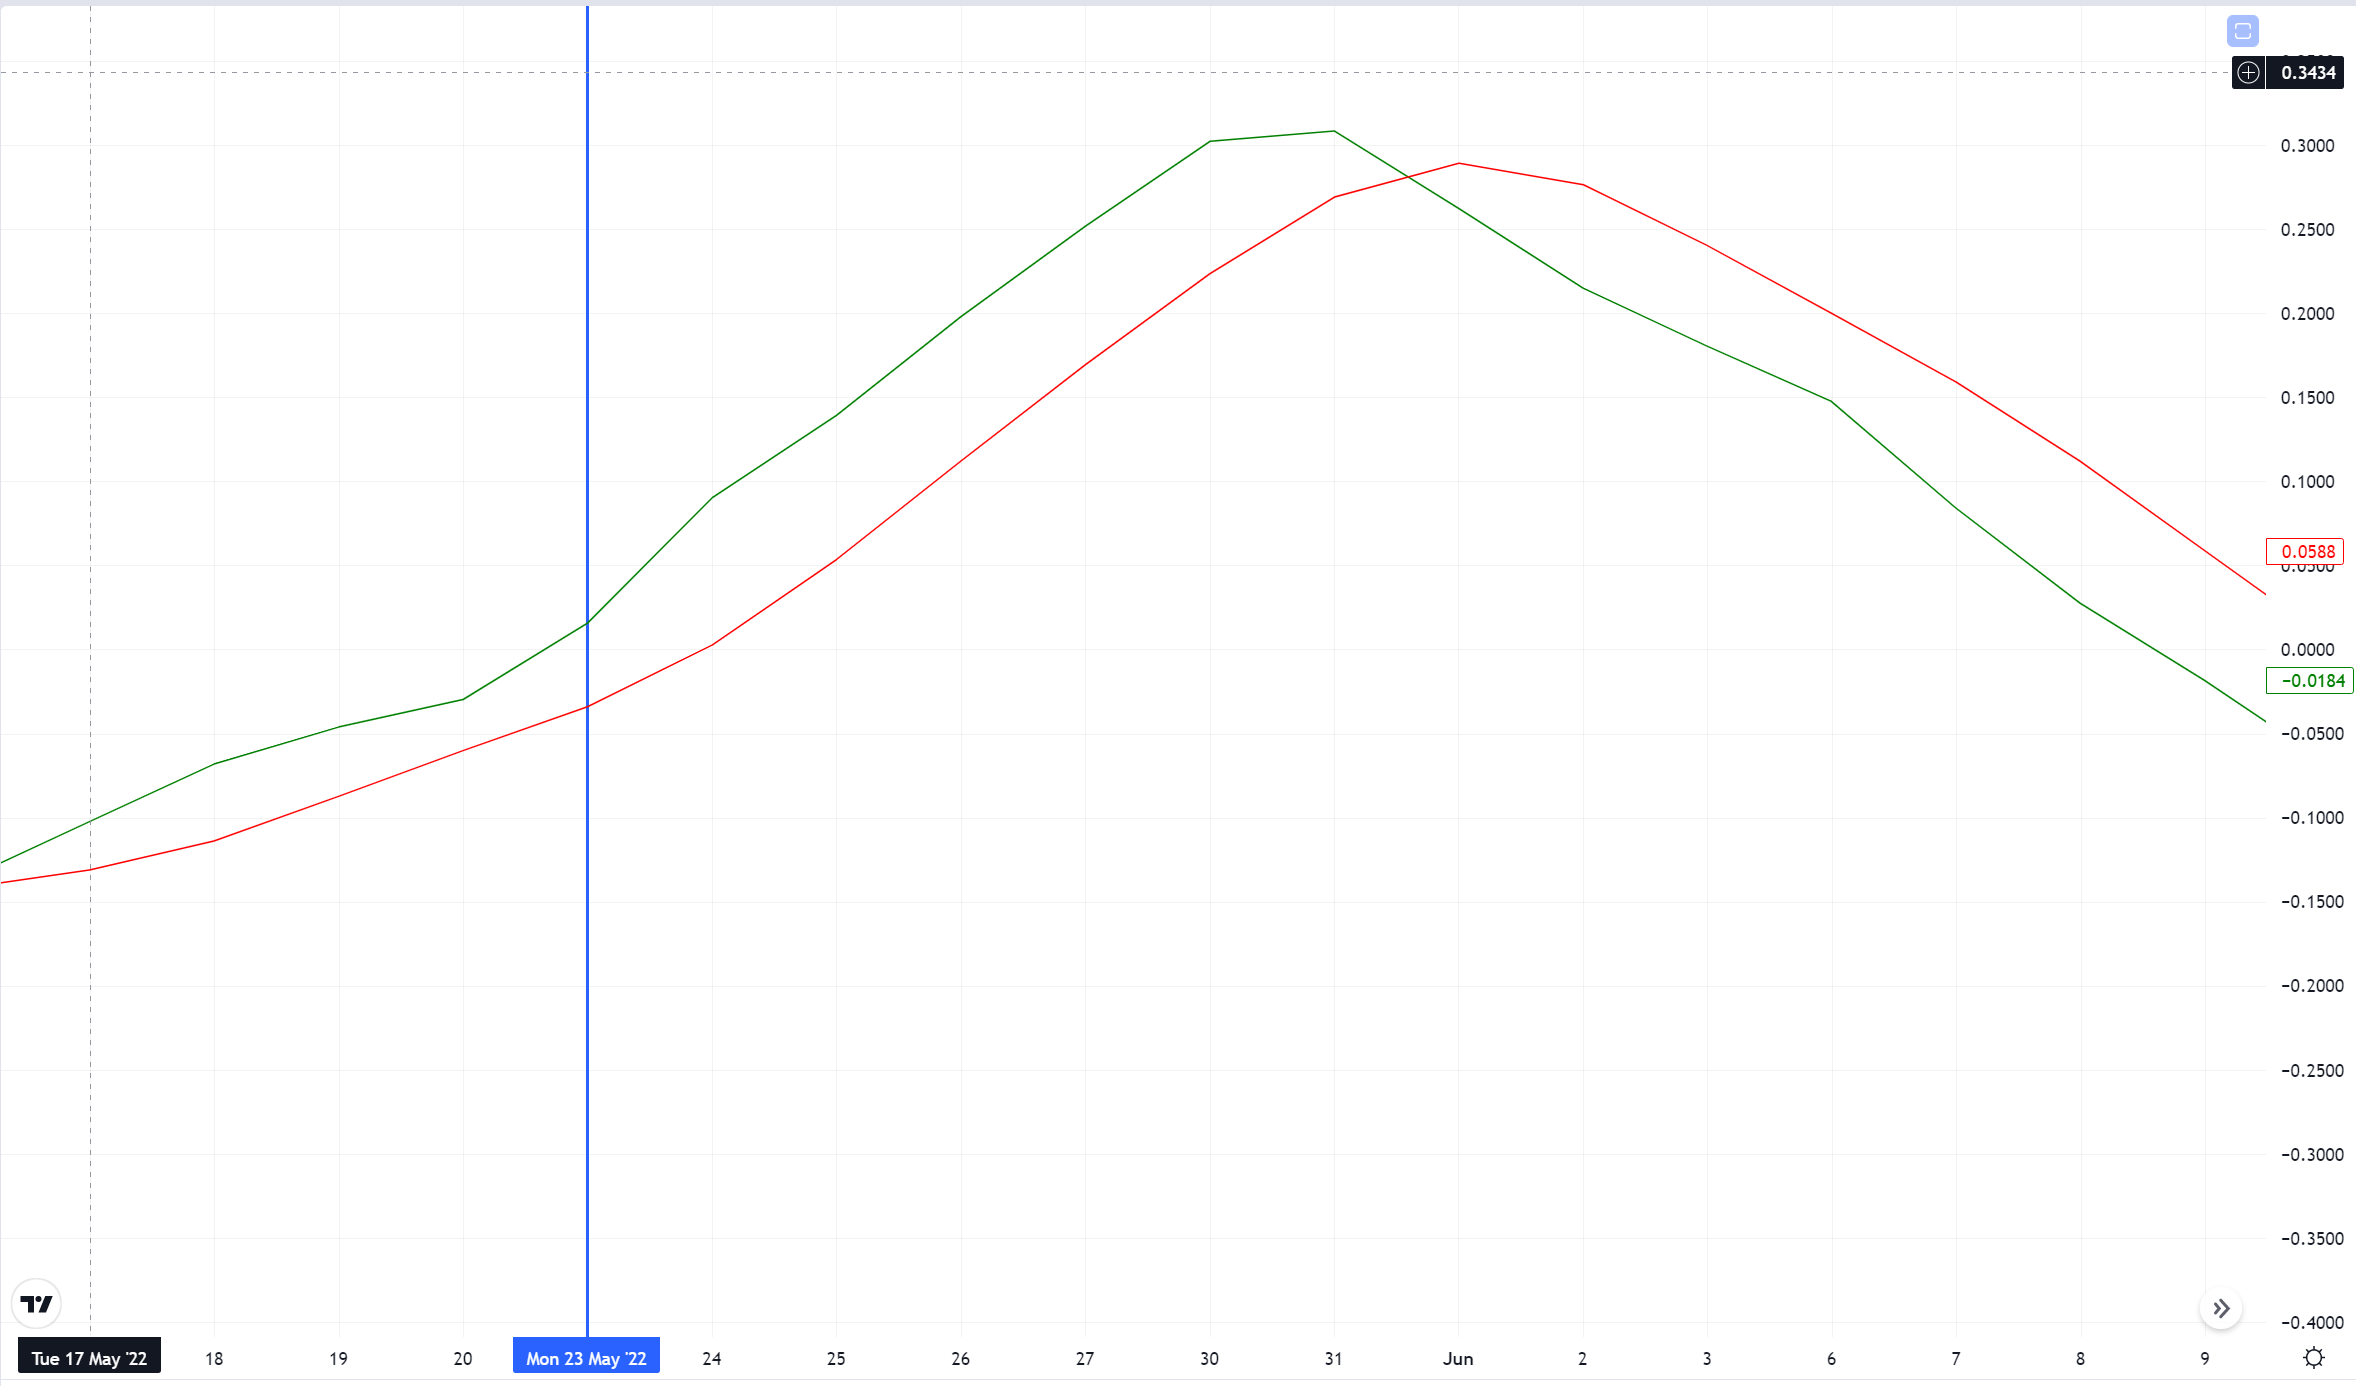
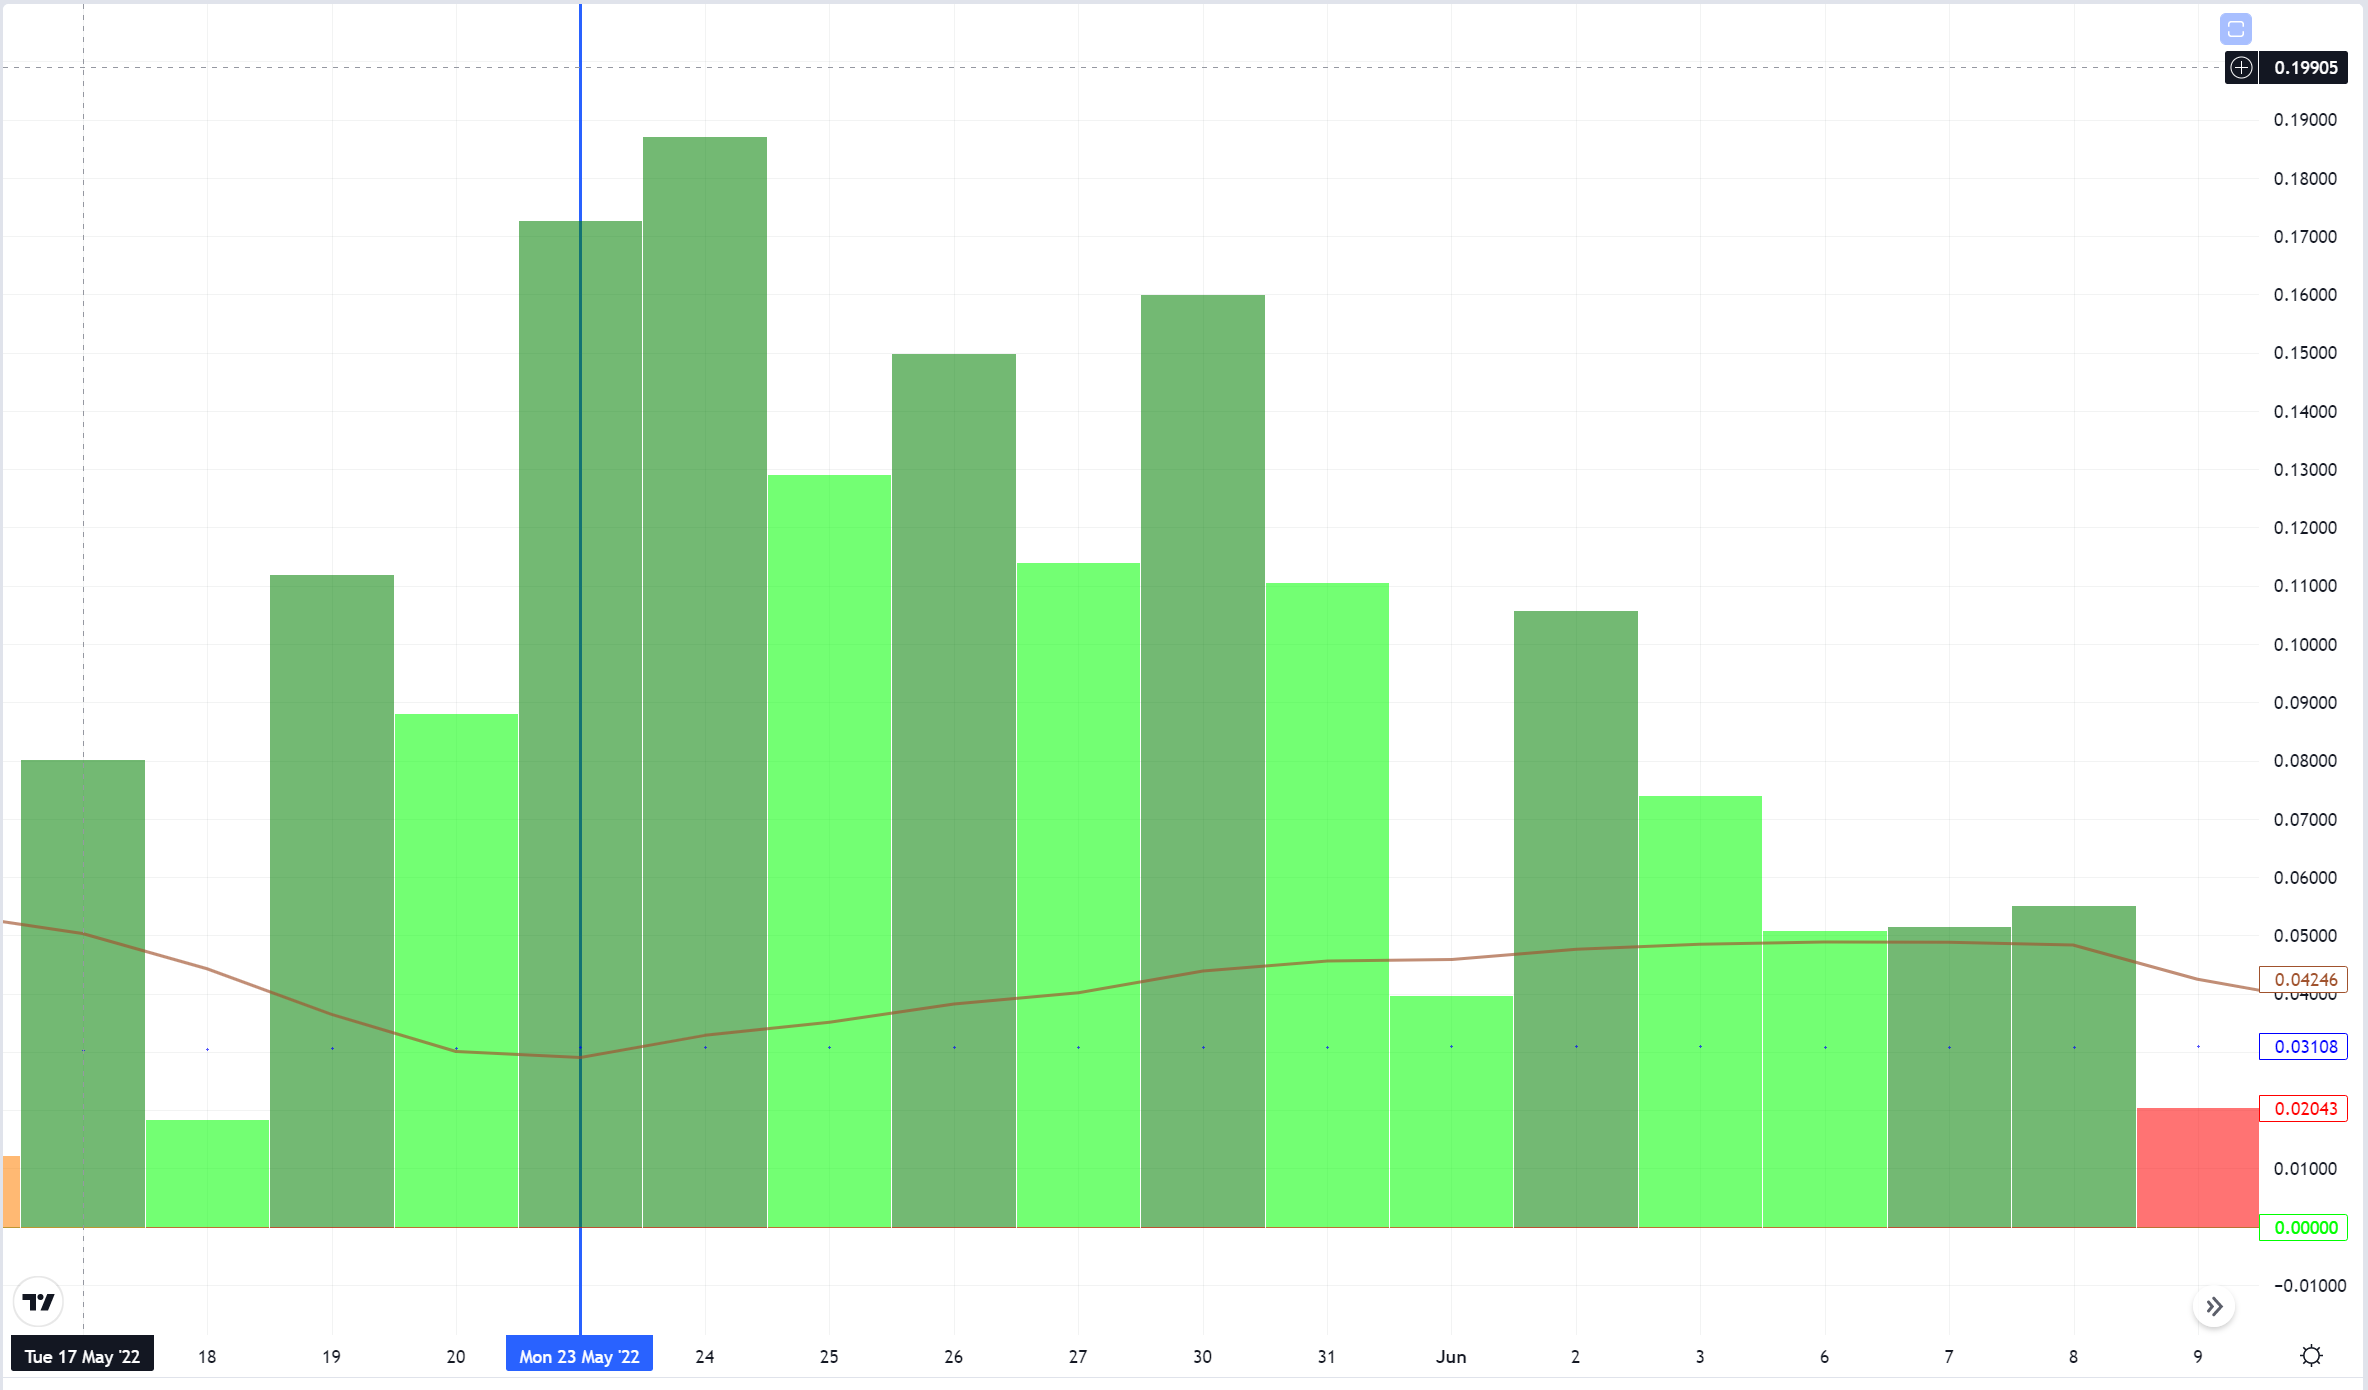
Volume indicator is bullish.
ATR position sizing indicates 161 pips, which puts me in 31,000 units (0.31 lots) based on risking 2% of a $25,000 account (approximately $500 risk).
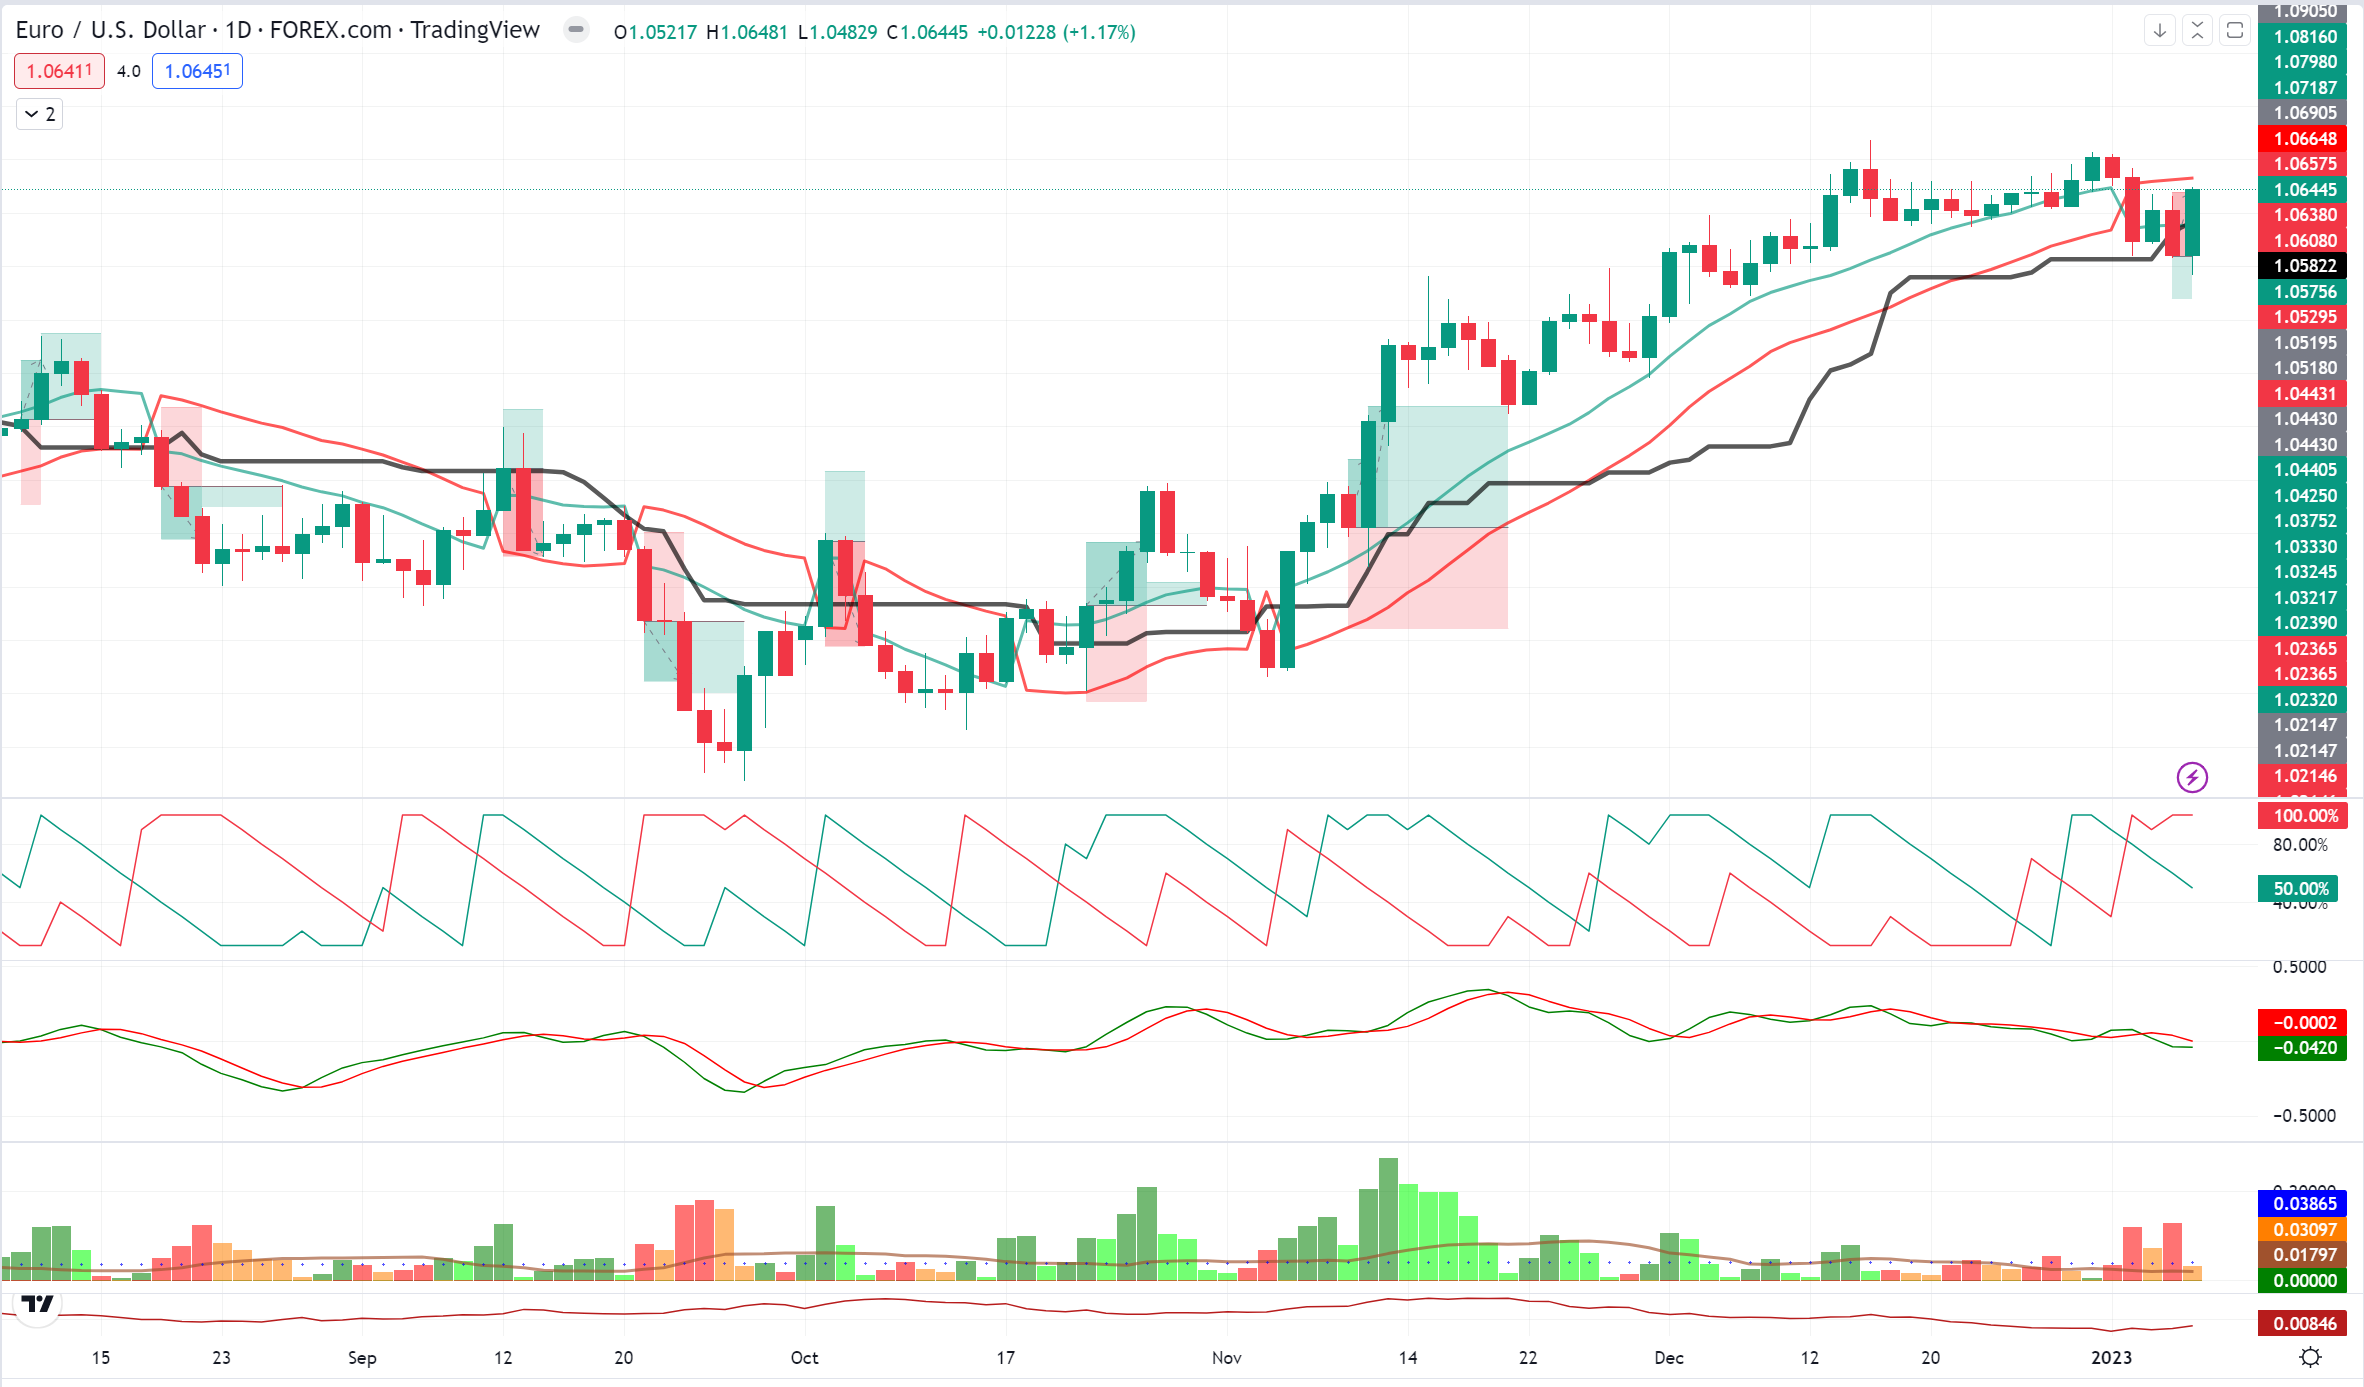
Here is how my full chart looks…
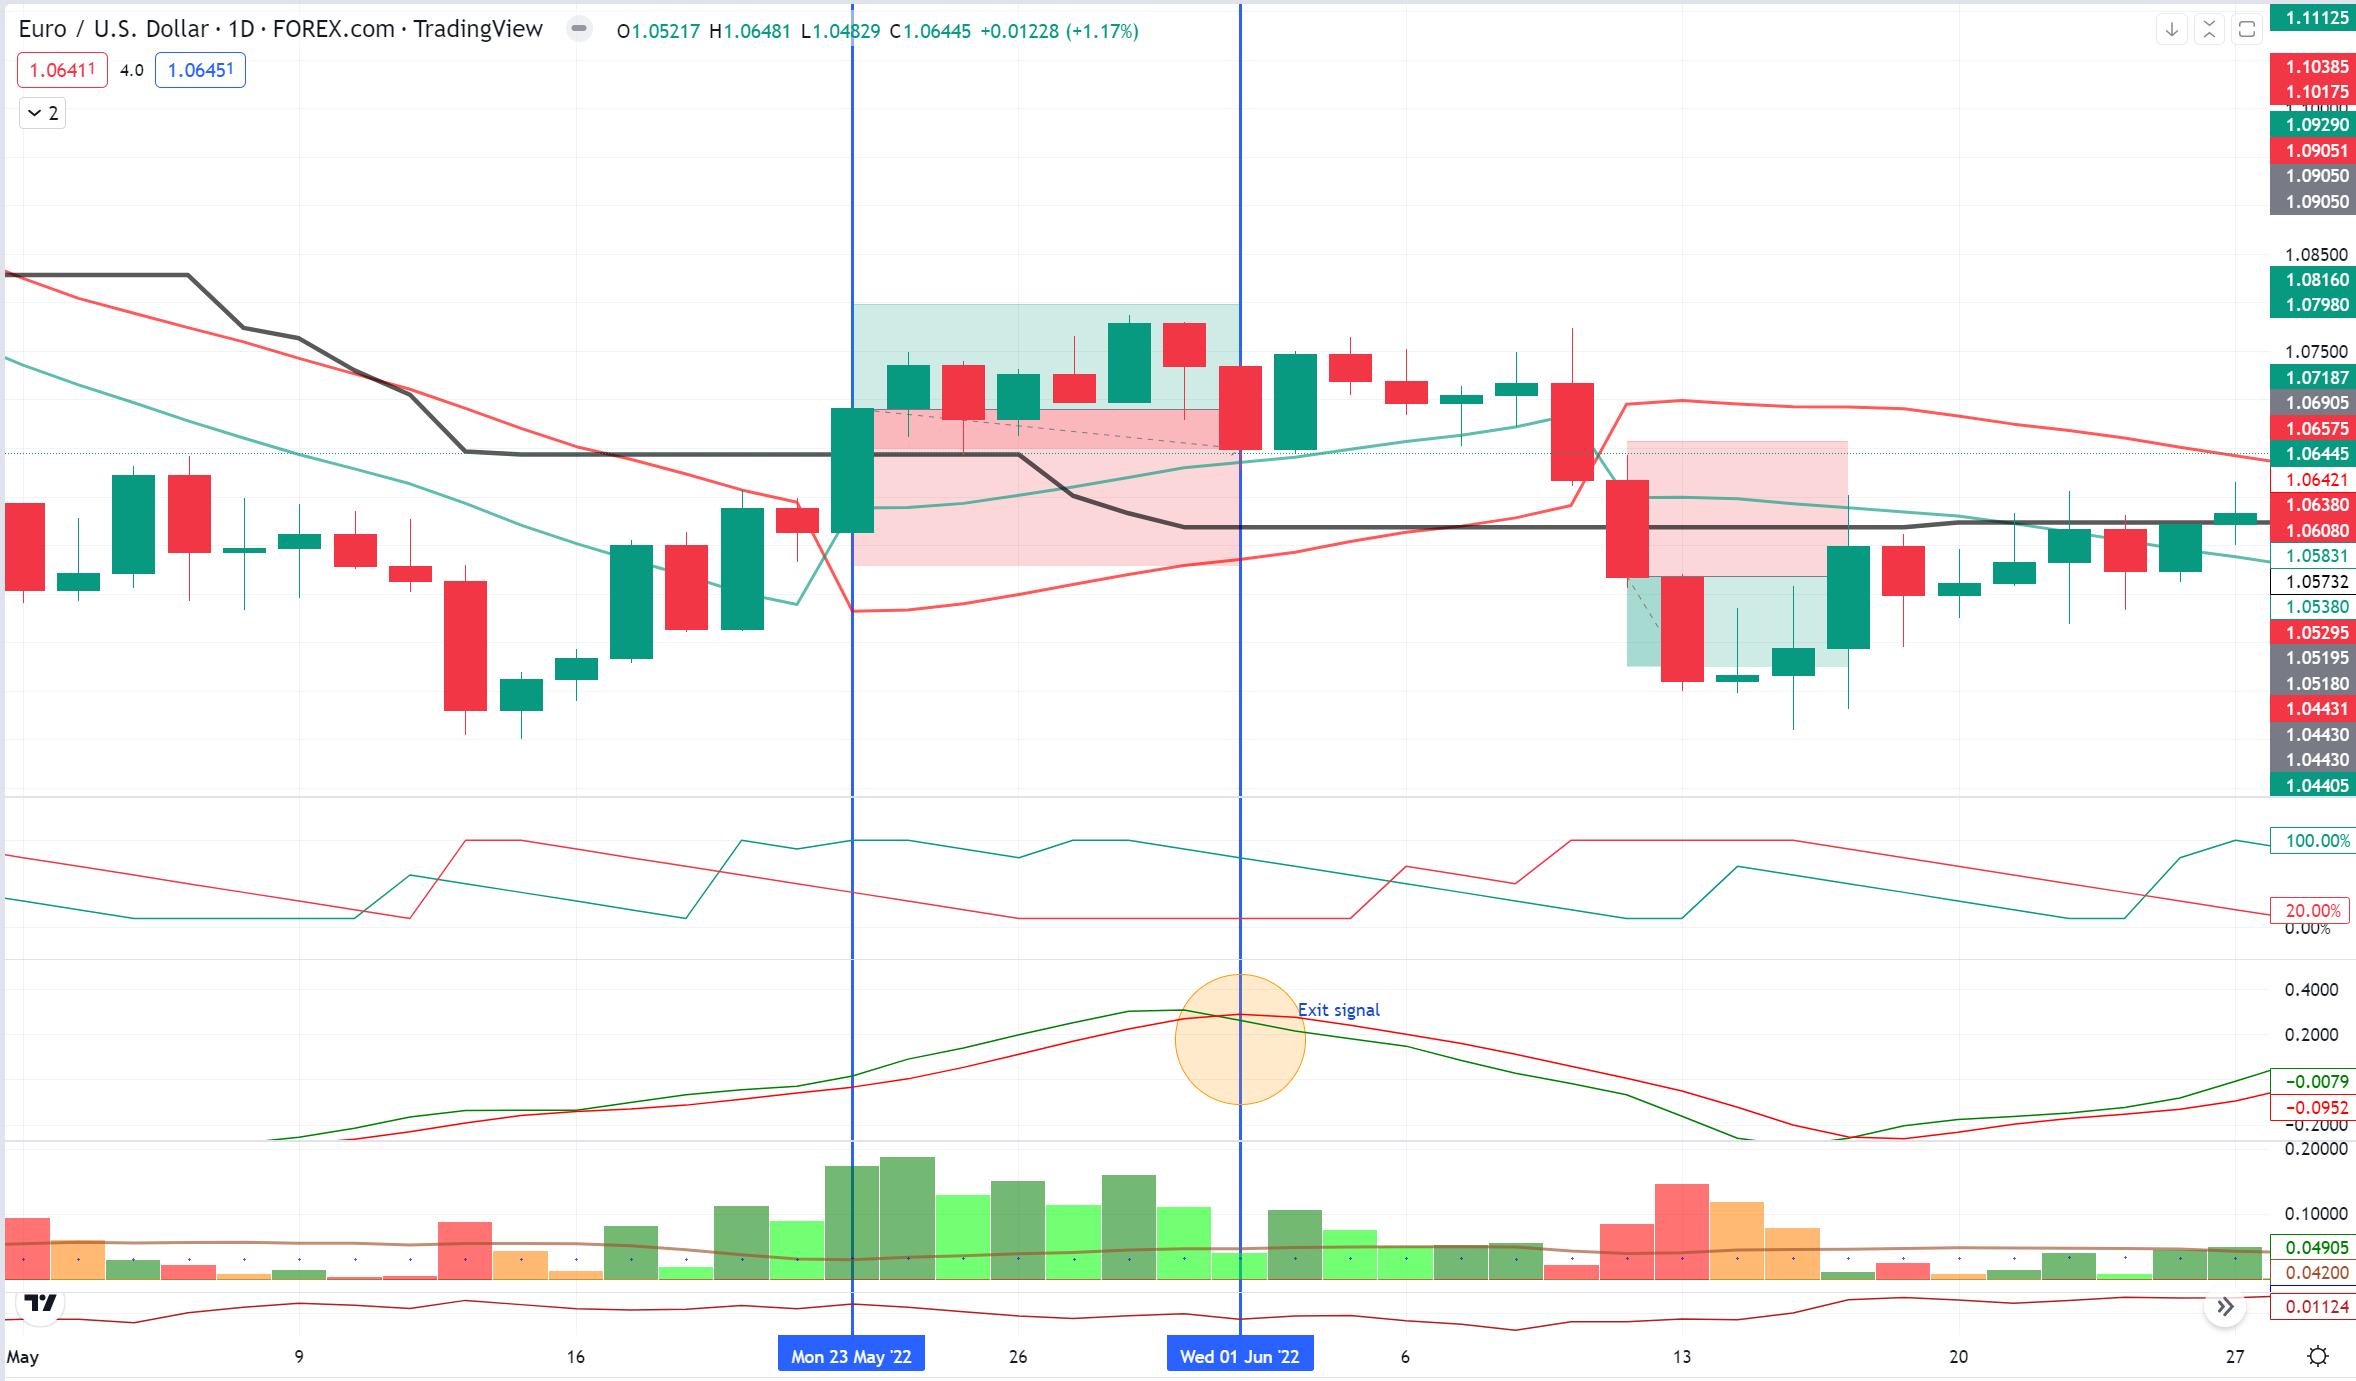
Note that this trade was manually stopped out on June 3, 2022 at the end of the day due to the exit signal. The total loss was $127.
Example 2 on EURUSD
July 1, 2022
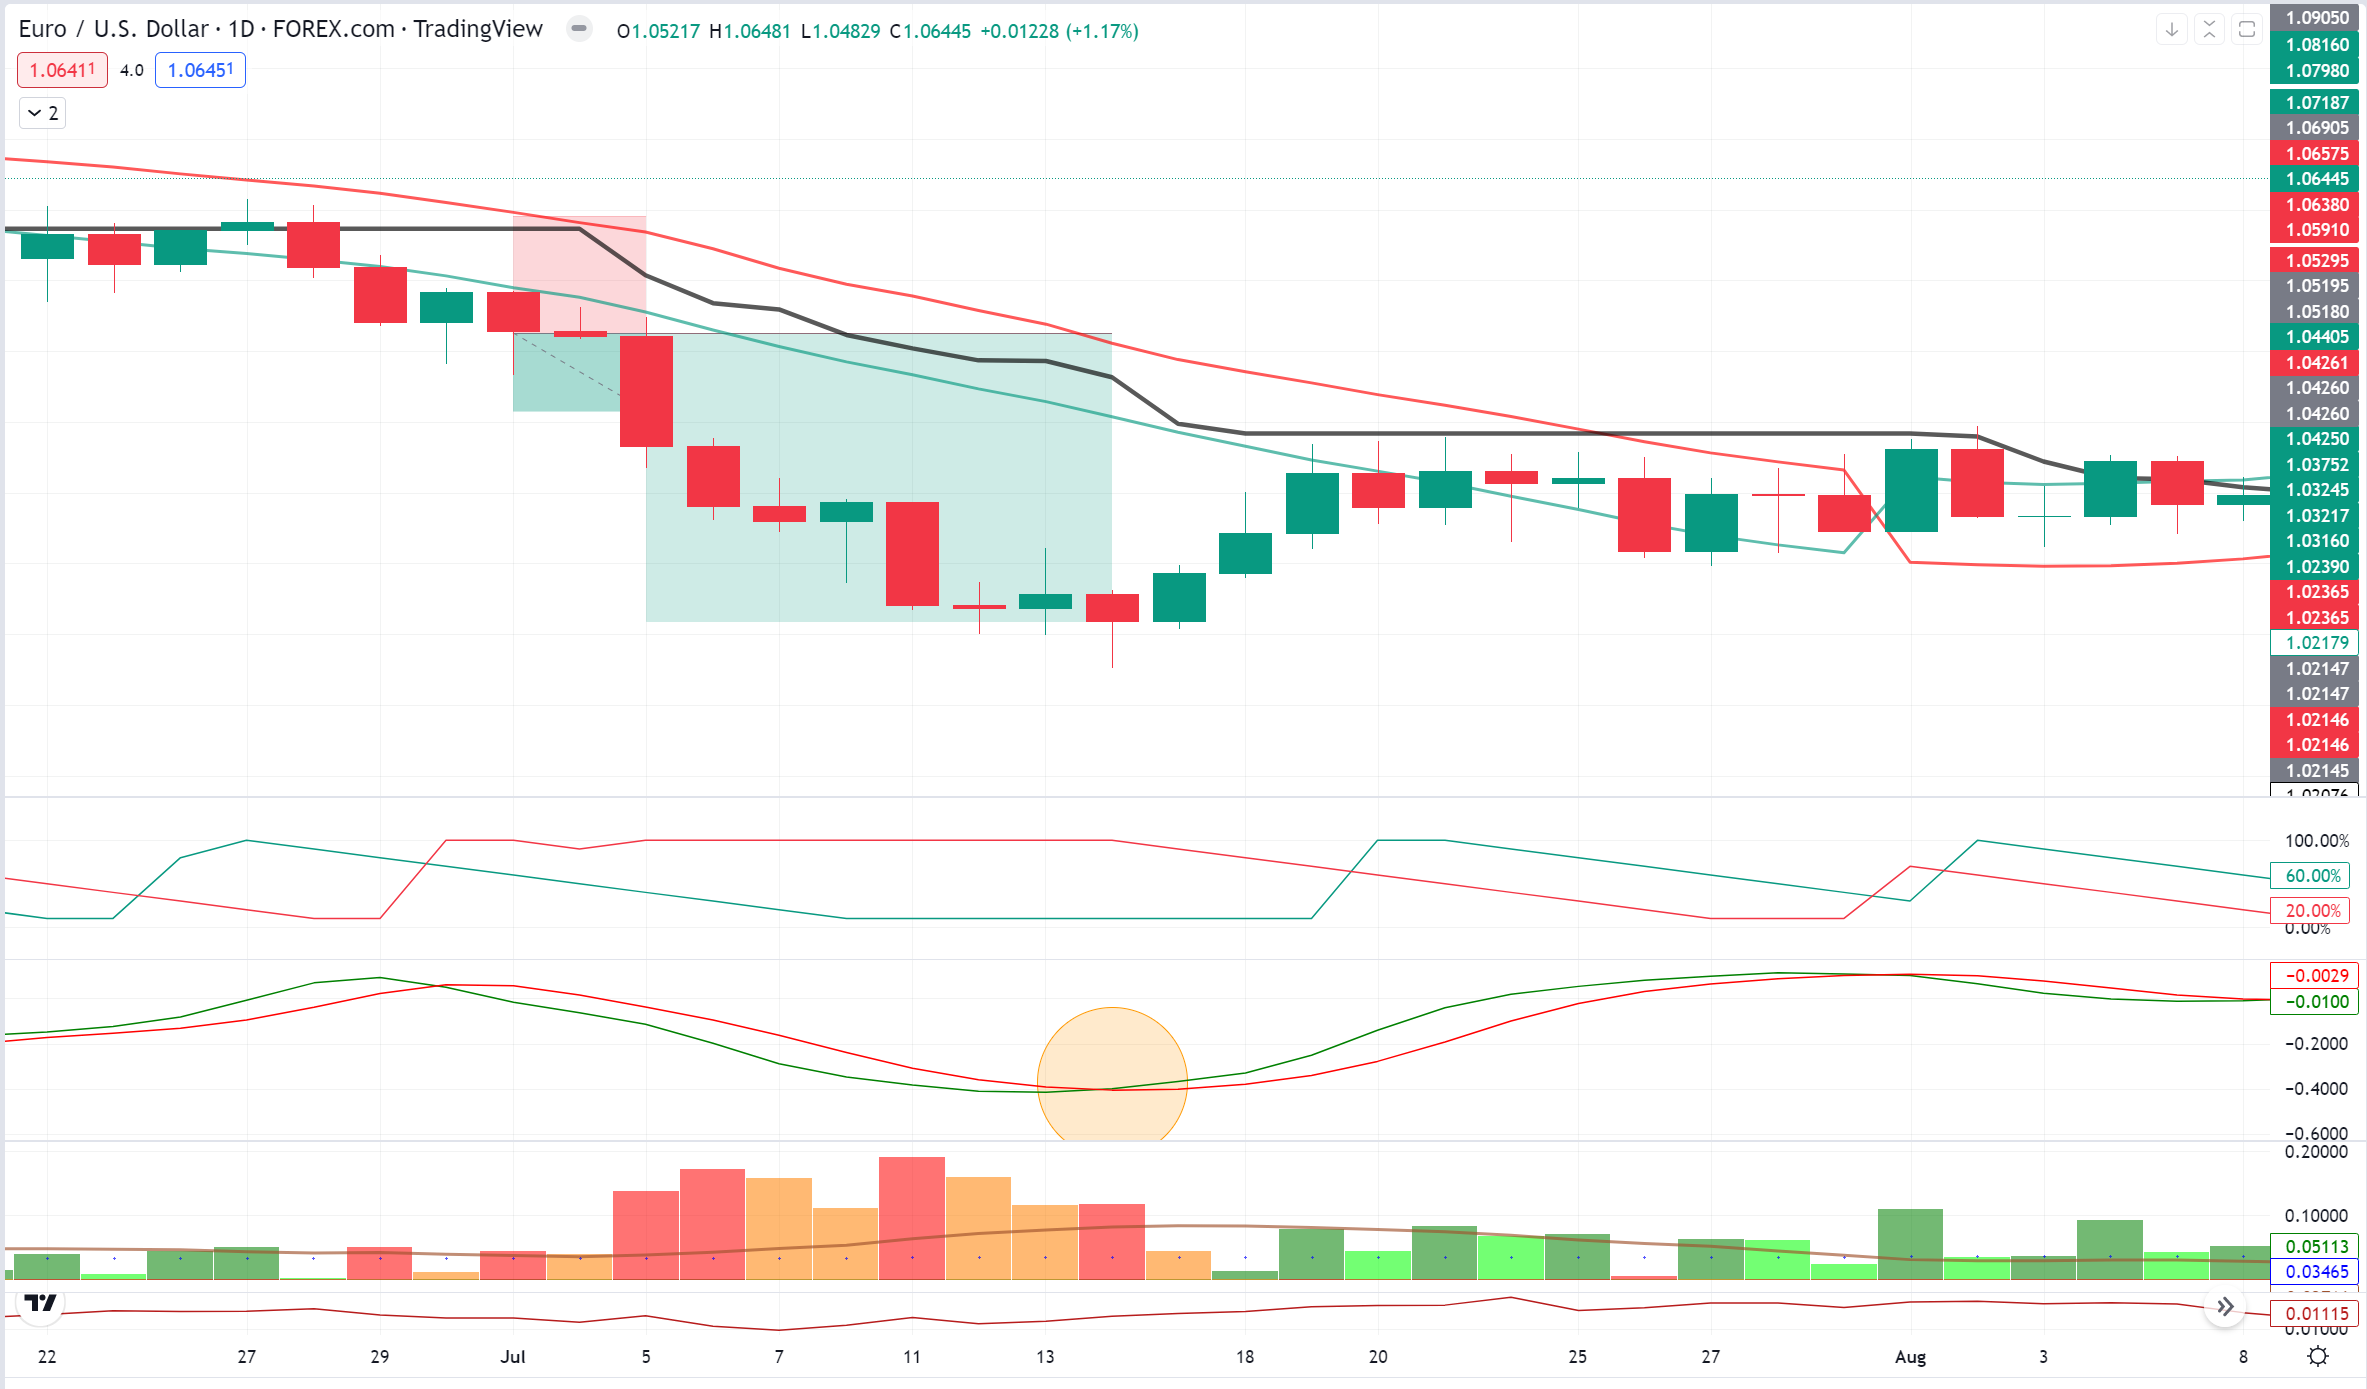
Price close below baseline. Price is also within 1.5 x ATR of baseline.
Confirming momentum indicator 1 is bearish
Confirming momentum indicator 2 is bearish
Confirming momentum indicator 3/exit signal is bearish
Volume indicator is bearish
ATR position sizing indicates 165 pips, which puts me in 30,000 units (0.30 lots) based on risking 2% of a $25,000 account (approximately $500 risk).
July 5, 2022 - 1/2 take profit triggers at 1 x ATR during the day for 15,000 units, move stop on remaining units to original entry.
July 14, 2022 (at 5:00 PM Wall Street Time) - Exit indicator triggers manual close of remaining 15,000 units.
Total profit: $777.00
System Development - Part II (Confirming Indicators)
As I mentioned earlier, I am not going to give full visibility of my system to free subscribers. However, I’m happy to provide guidance on some of my favorite indicators (also on the ones I don’t like). It will be up to readers to test, figure out the correct settings, and assemble into their own recipe.
As many of my long term followers know - I don’t do anything standard. Why? Because I am trading against institutions. I don’t want to use the same things that they are looking at. Period.
Here are a couple of indicators I don’t like for a multi-layered system:
MACD
RSI (this one may surprise GG Overnight Gap System traders).
ADX/DMI
Bollinger Bands
My favorite indicators involve either a two line crossover or a zero line cross. Here are a couple to look at:
Semaphore Signal Level (SSL)
The SSL is an indicator that combines moving averages to provide you with a clear visual signal of price movement dynamics. In short, it's designed to show you when a price trend is forming. It shows you two different-coloured lines that follow the evolution of prices. When the two lines intersect, the indicator signals that the price movement is changing direction or is about to. When the bullish line (I use green) is above the bearish line (I use red), the trend is bullish; when the bearish line is above the bullish line, the trend is bearish.
The standard SSL settings are shown below on ES!, which signals a bullish turn as of Friday, January 6th.. Note - I don’t use standard settings. I test, test, test, then test some more. In the beginning I start off with standard. Then I advance to modify the settings to provide the highest win/loss ratio in combination with my baseline.
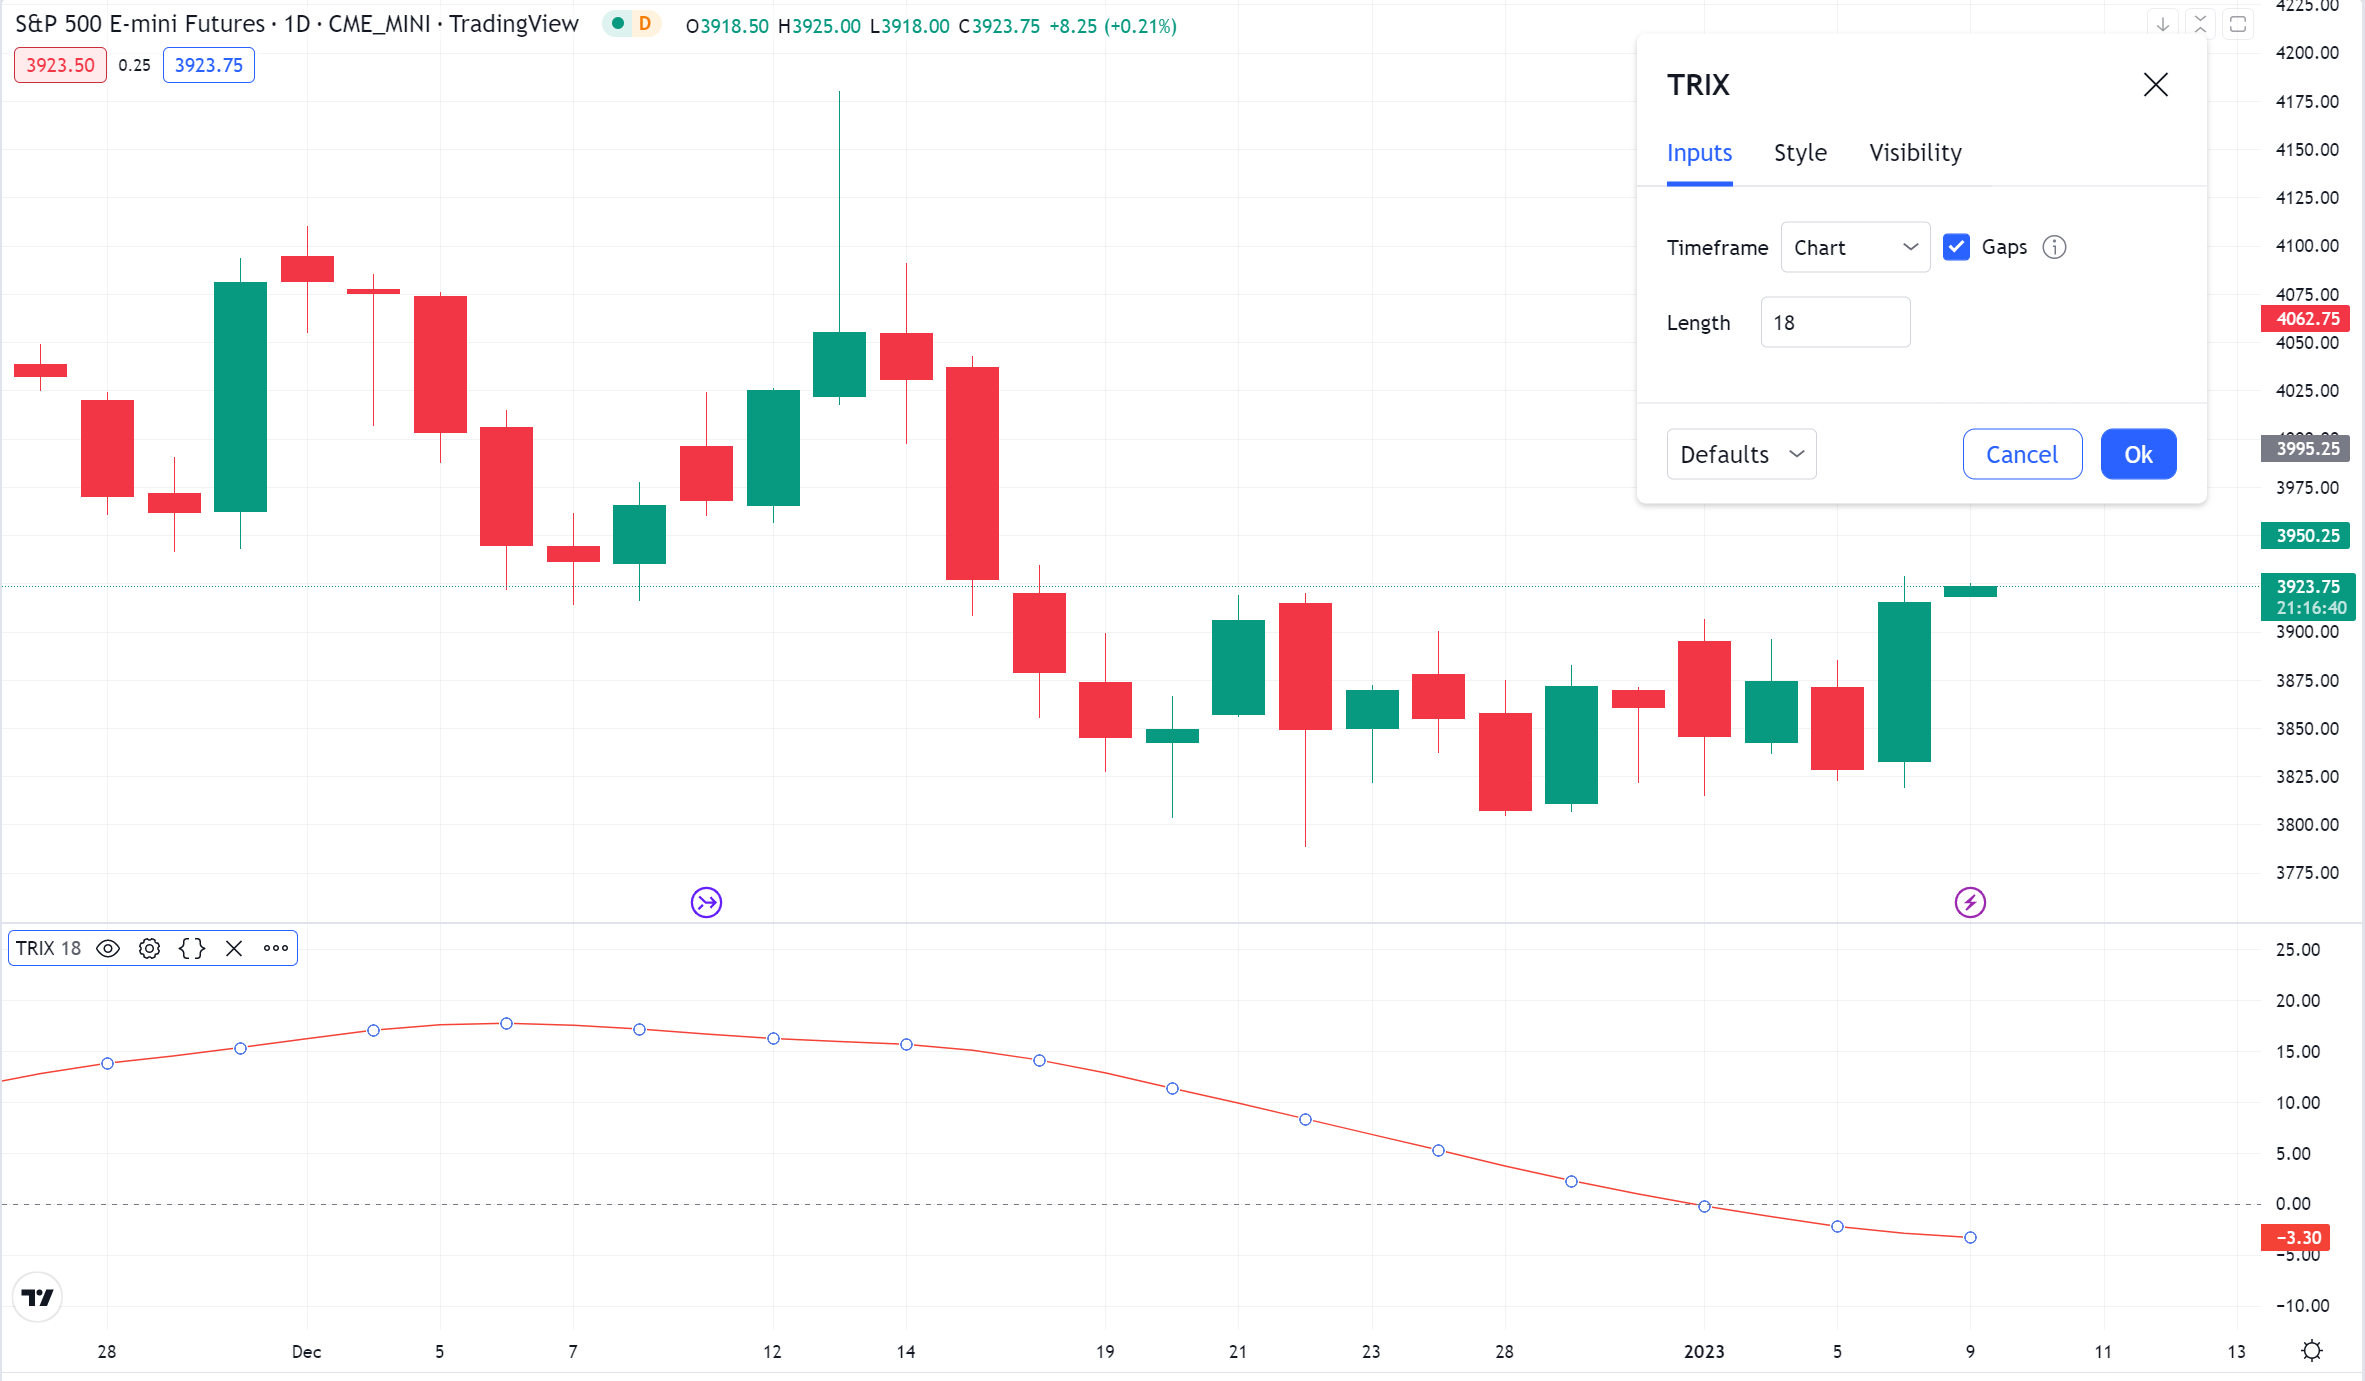
Triple Exponential Moving Average (TRIX)
The TRIX is an oscillator that shows the percentage change in a moving average that has been smoothed exponentially three times. The triple smoothing of moving averages is designed to filter out price movements that are considered insignificant or unimportant. When the TRIX crosses above the zero line, it gives a buy signal, and when it closes below the zero line, it gives a sell signal.
The standard TRIX settings are shown below, which shows that ES! is bearish. Again, I don’t use standard settings.
There are hundreds of indicators on TradingView. I have tested most of them (which adds credence to my claim to have spent thousands of hours back testing). I would encourage readers to spend time on the above, see how they work out and then go back two years to back test against a baseline. If you are able to get two individually optimized indicators against your baseline, redo the back test to see how all three work (baseline + two indicators).
Over the next several months, I will be occasionally adding a section to posts to review interesting indicators that I discover.
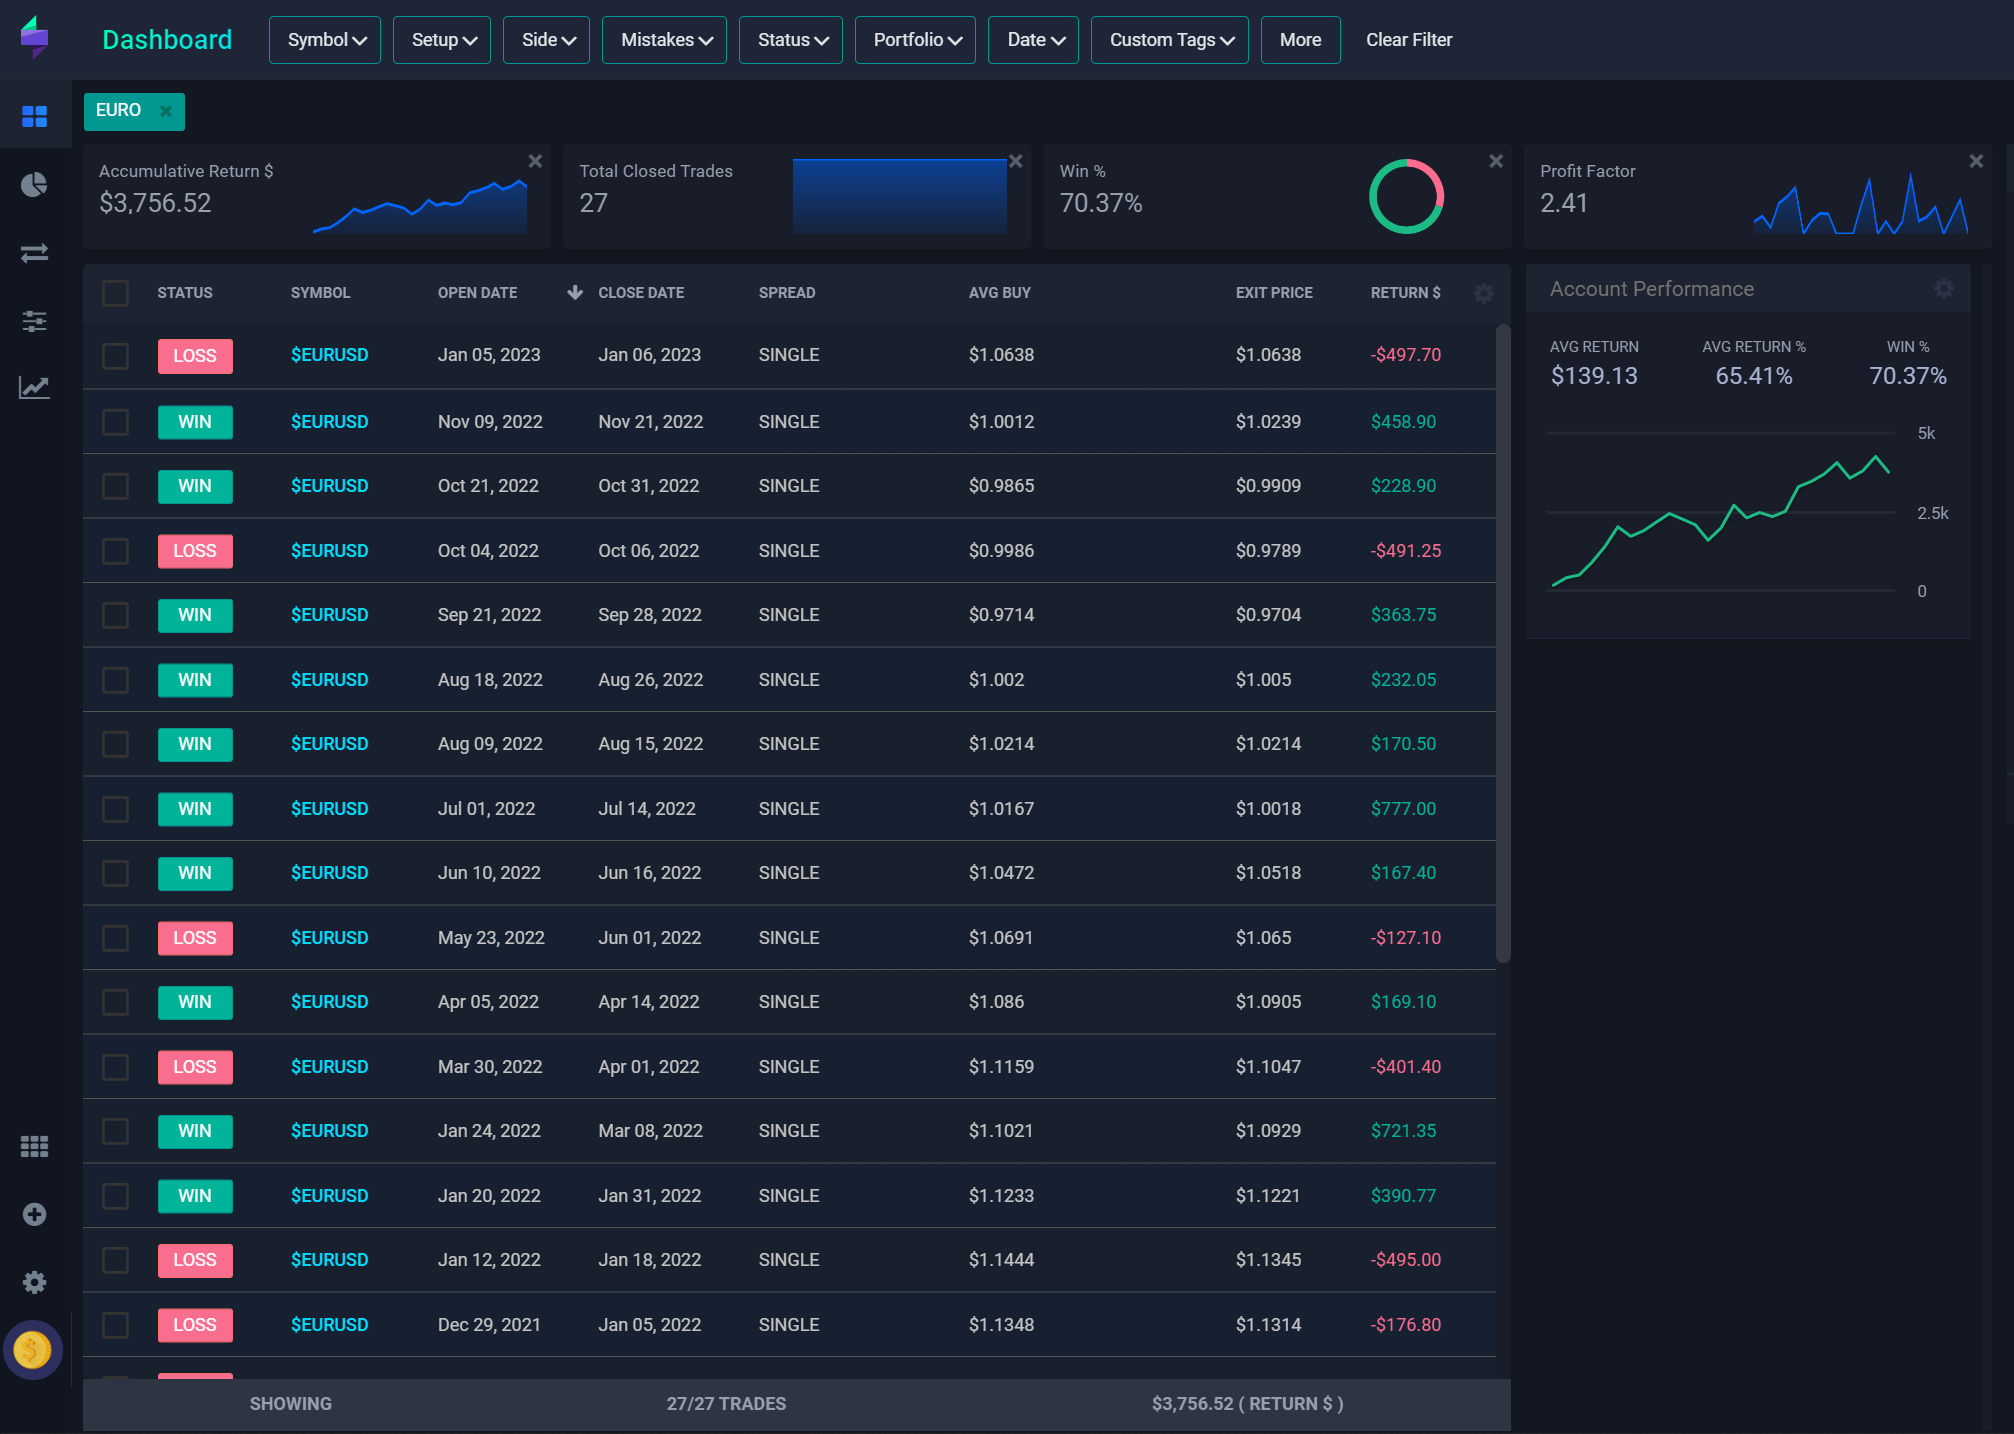
By the way, Premium subscribers will see my exact algo for daily candles, which produced a 70.37% win/loss ratio and 2.41 profit factor on EURUSD over the past two years.
Earnings Season - Winter 2023
Our next earnings season is upon us. This is actually the main subject of this substack. The below premium section has some pre-alerts for the coming two weeks.
Keep reading with a 7-day free trial
Subscribe to Green Goose Trader to keep reading this post and get 7 days of free access to the full post archives.